Teach Engineering
Forms of Linear Equations
Linear equations are all about form. The fifth part in a unit of nine works with the different equivalent forms of linear equations. Class members become familiar with each form by identifying key aspects, graphing, and converting from...
Illustrative Mathematics
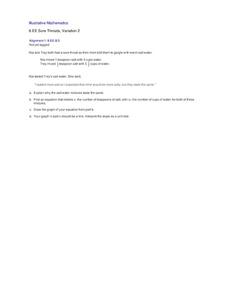
Sore Throats, Variation 2
What does math have to do with a sore throat? When you mix water and salt you have a great review of how to represent proportional relationships by an equation or graph. Here the proportions of the mixtures may be different, but the...
Teach Engineering
Coordinates and the Cartesian Plane
The plot thickens to get a functional understanding. After a short review of plotting points on the coordinate plane, class members learn the difference between functions and relations in the second lesson in a series of nine. They show...
Teach Engineering
The Challenge Question
A research position becomes a modeling job. The introductory lesson in a series of nine presents the challenge of analyzing a set of bivariate data. The class brainstorms what the data may represent. Pupils must decide what is needed to...
Curated OER
Graphs and Functions
Use this series of activities to introduce learners to graphing functions. They graph both linear and quadratic equations by hand and with a Graph Sketcher Tool. Several imbedded links and handouts are included in the lesson.
Teach Engineering
Club Function
Let's get the herd to follow the rules. The activity associated with the second lesson in the unit introduces the class to the definition of a function. Individuals must gather in groups of zebras and rhinos defined by the general...
West Contra Costa Unified School District
Exploring Quadratics and Graphs
Young mathematicians first graph a series of quadratic equations, and then investigate how various parts of the equation change the graph of the function in a predictable way.
Alabama Learning Exchange
Fortune Properties
Complete identity and equality property problems in hands-on activities. Smart cookies identify the identity and equality properties. They complete a review of order of operations, watch an online video, and make a foldable with the...
Curated OER
Y-Intercept and Slope Intercept Form
Alegebra amateurs identify the slope and the y-intercept given a linear equation in slope-intercept form by correctly completing some in class problems. They write the linear equation in slope-intercept form that corresponds to the given...
Curated OER
Left Hand, Right Hand - Solving Systems of Equations
Students compare the speed at which they write with their left hand to the speed at which they write with their right hand. The experiment serves as a vehicle to help students develop a conceptual understanding of the three different...
Curated OER
What's Your Shoe Size? Linear Regression with MS Excel
Learners collect and analyze data. In this statistics lesson, pupils create a liner model of their data and analyze it using central tendencies. They find the linear regression using a spreadsheet.
Teach Engineering
Matching the Motion
It is not always easy to walk the straight and narrow. In the sixth portion of a nine-part unit, groups actively recreate a graph depicting motion. Individuals walk toward or away from a motion detector while trying to match a given...
Teach Engineering
Spring Away!
The last segment of the nine-part unit makes a connection between springs and linear equations. Groups hang weights from the spring and measure its length. Then, using the data collected, they calculate the slope to find the k-value of...
Curated OER
Data Displays with Excel
Students collect and analyze data. In this statistics lesson, students display their data using excel. They plot the data on a coordinate plane and draw conclusion from their data.
Curated OER
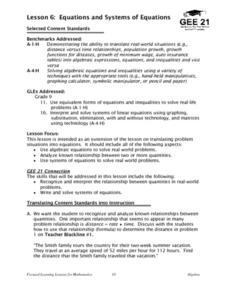
Equations and Systems of Equations
Students practice using algebra to be applied to real world situational problems. The key concepts of translation of language to algebraic expressions is covered. They also look in depth at relationships between different quantities.
Curated OER
Using Inequalities to Problem Solve
Students explore inequalities. In this Algebra I lesson, students solve and graph linear inequalities involving addition, subtraction, multiplication, or division. Students use inequalities to solve and graph real-world problems.
Curated OER
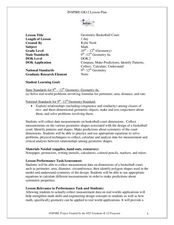
Geometric Basketball Court
Students calculate the area and perimeter of a basketball court. For this geometry lesson, students differentiate between similarity and congruence of geometric objects. They test conjectures and use it to solve problems.
Curated OER
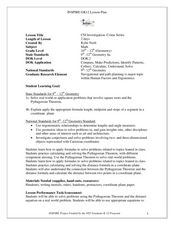
CSI Investigation
Students solve real life situation using the Pythagorean Theorem. In this geometry lesson, students calculate the length, midpoint and slope of segments. They solve word problems using properties of square roots.
Curated OER
Basic Algebra and Computers: Spreadsheets, Charts, and Simple Line Graphs
Students, while in the computer lab, assess how to use Microsoft Excel as a "graphing calculator." They view visual representations of line graphs in a Cartesian plane while incorporating basic skills for using Excel productively.


