Charleston School District
Graphing Functions
How do letters and numbers create a picture? Scholars learn to create input/output tables to graph functions. They graph both linear and nonlinear functions by creating tables and plotting points.
Saxon
Plotting Functions
Youngsters use a graphing calculator to assist in creating a function table. They graph the function on a coordinate plane. They explore the relationship between the domain and range in the graph. This four-page worksheet contains two...
Mathed Up!
Straight Line Graphs
Develop graphs by following the pattern. The resource provides opportunities for reviewing graphing linear equations. Pupils create tables to graph linear equations by using patterns whenever possible. The worksheet and video are part of...
Curated OER
Introduction to Functions
Students explore functions, function rules, and data tables. They explore terms of linear functions. Students use computers to analyze the functions. Students write short sentences to explain data tables and simple algebraic expressions.
Curated OER
Chapter 4 Test: Functions and Integers
In this functions and integers worksheet, learners combine positive and negative integers through addition, subtraction, multiplication and division. They complete function tables and graph the results of linear equations. This six-page...
Illinois State Board of Education
Is It Linear?
Math apprentices are introduced to the components of a linear relationship. In groups, they write story problems that incorporate this relationship and relates to the real world. They give their problem to the class for them to solve.
EngageNY
Representations of a Line
Explore how to graph lines from different pieces of information. Scholars learn to graph linear functions when given an equation, given two points that satisfy the function, and when given the initial value and rate of change. They solve...
Curated OER
Reading Graphs
Working independently or in teams, your class practices connecting graphs, formulas and words. This activity includes a guided discussion about distance vs. time graphs and looking at how velocity changes over time.
Mathematics Vision Project
Module 4: Linear and Exponential Functions
Sequences and series are traditionally thought of as topics for the pre-calculus or calculus class, when learners are figuring out how to develop limits. But this unit uses patterns and slopes of linear functions in unique ways to bring...
EngageNY
Modeling Linear Relationships
Math modeling is made easy with the first installment of a 16-part module that teaches pupils to model real-world situations as linear relationships. They create graphs, tables of values, and equations given verbal descriptions.
5280 Math
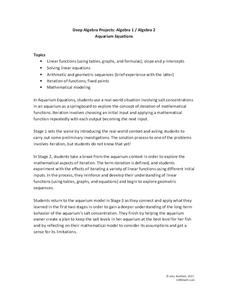
Aquarium Equations
Take a look at linear functions in a new environment. A three-stage algebra project first asks learners to model the salt concentration of an aquarium using linear functions. Then, using iterations, pupils create a set of input-output...
Teach Engineering
Applications of Linear Functions
It's not so straightforward — lines can model a variety of applications. Pupils experience linear relationships within the context of science, including Hooke's and Ohm's Laws. Class members got a taste of motion and speed from the...
Virginia Department of Education
Functions 2
Demonstrate linear and quadratic functions through contextual modeling. Young mathematicians explore both types of functions by analyzing their key features. They then relate these key features to the contextual relationship the function...
Mathematics Vision Project
Module 2: Linear and Exponential Functions
Write, graph, and model all things linear and exponential. Building on the previous module in a nine-part Algebra I series, learners compare linear exponential modeling. They write equations, graph functions, and analyze key features.
Curated OER
Profitable Soda Stand
Am I making any money? Help learners determine if their fictitious soda stand is turning a profit. They graph linear equations using the slope and y-intercept and identify the best price to use to sell soda. They identify the domain and...
Shodor Education Foundation
Function Flyer
Fly through graphing functions with the Function Flyer. Young mathematicians use an interactive to graph different types of functions. A set of exploration questions has users investigate patterns in functions.
West Contra Costa Unified School District
Linear-Quadratic Systems
Why do I have to learn two different ways to solve linear-quadratic systems? Isn't one way enough? Learners first investigate the three possible situations for linear-quadratic systems (two, one, or zero solutions), then solve such...
Charleston School District
Review Unit 3: Functions
Time to show what you know about functions! The review concludes a series of nine lessons on the basics of functions. The problems included are modeled from the previous lessons. Pupils determine if a table represents a function,...
Curated OER
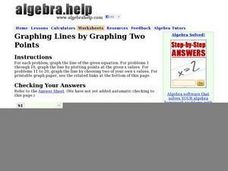
Graphing Lines by Graphing Two Points
Use a graphing lines worksheet to have your mathematicians graph the line of a given equation and plot specified points. The first 10 problems have a given equation, and two values. The next 10 problems have a given equation, but your...
West Contra Costa Unified School District
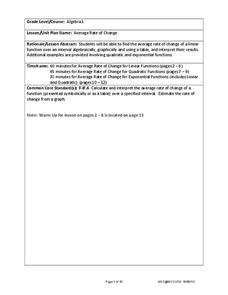
Average Rate of Change
Learners investigate average rates of change for linear functions and connect the concept to slope. They then determine average rates of change in quadratic and exponential functions.
Curated OER
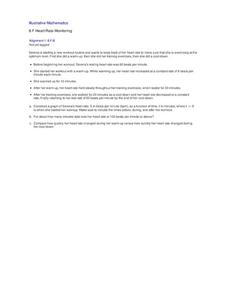
Heart Rate Monitoring
Algebra learners like this resource because it is easy to understand and it relates to their lives. Whether you are starting a new workout routine, or just climbing the stairs, your heart rate increases and decreases throughout the day....
Curated OER
Interactivate: Introduction to Functions
This interactive website provides a variety of lesson plans according to which standards you are applying and which textbook you use. Introduce functions to your class by having them construct single operation machines and create...
Illustrative Mathematics
Velocity vs. Distance
At the end of this activity, your number crunchers will have a better understanding as to how to describe graphs of velocity versus time and distance versus time. It is easy for learners to misinterpret graphs of velocity, so have them...
CK-12 Foundation
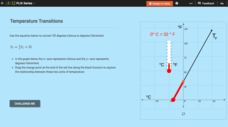
Linear Equations: Temperature Transitions
Explore linear conversions using an engaging interactive lesson. Learners drag a point on a graph to discover the equivalent degrees in Fahrenheit and Celsius. Embedded questions highlight key features such as slope and the y-intercept.


