Curated OER
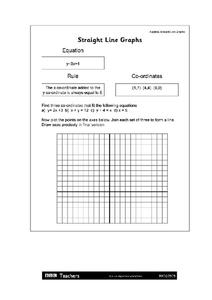
Straight Line Graphs
In this straight line graph worksheet, students identify linear equations. They plot points of given problems. This one-page worksheet contains 3 problems.
Curated OER
Dilations and Similarity
In this dilations and similarity worksheet, pupils solve 10 different problems that include various dilations. First, they determine the scale factor of dilations found in the illustrated graphs. Then, everyone determines the coordinates...
Kuta Software
Reflections of Shapes
In this reflection of shapes worksheet, learners graph images on a coordinate plane. They reflect the image and sketch it on the graph. They write a rule to describe the transformation. This four-page worksheet contains 14 problems....
Curated OER
Walk-A-Thon
Students graph linear http://www.lesson planplanet.com/review?id=180542equations. In this problem solving lesson plan, students calculate slope and plot ordered pairs on a coordinate grid. Using a real-life example of a walk-a-thon,...
Curated OER
Systems of Equations and Inequalities
This is a comprehensive lesson on creating and solving equations and systems of equations and inequalities. Problems range from basic linear equations to more complex systems of equations and inequalities based on a real-world examples....
Curated OER
Profitable Soda Stand
Am I making any money? Help learners determine if their fictitious soda stand is turning a profit. They graph linear equations using the slope and y-intercept and identify the best price to use to sell soda. They identify the domain and...
Curated OER
Barbie Bungee
Middle and high schoolers collect and analyze their data. In this statistics lesson plan, pupils analyze graphs for linear regression as they discuss the relationship of the function to the number of rubber bands and the distance of the...
Google
Midpoint and Distance Foldable
Support young mathematicians with learning the concepts of midpoint and distance with this foldable resource. Offering both graphic examples and written equations, this reference clearly demonstrates for students how these key terms...
Agile Mind
Transforming Graphs of Quadratic Functions
In the activity on this webpage, learners use interactive graphing technology to investigate transformations of graphs. In the first part of the task, they look at the graph of a quadratic function with coordinates of a few points...
Illustrative Mathematics
Transforming the graph of a function
This activity guides learners through an exploration of common transformations of the graph of a function. Given the graph of a function f(x), students generate the graphs of f(x + c), f(x) + c, and cf(x) for specific values of c. The...
Curated OER
Graphing Inequalities in Two Variables
This study guide is a great resource to help you present the steps to graphing linear inequalities. Show your class two different ways to graph an inequality and work on a real-world example together. The document could also be easily...
Illustrative Mathematics
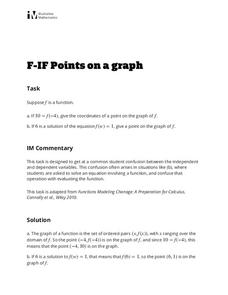
Points on a Graph
Learners practice using their knowledge of how to interpret a function and use function notation. The activity includes two questions. Given an input of a function and its output, the first question asks learners to write the ordered...
Curated OER
Solving multi-step inequalities and solving systems by elimination
Students solve multi-step equations and apply the process of elimination. In this algebra lesson, students solve linear inequalities and equations using linear combination and evaluation. They graph their results on a number line and...
Curated OER
Algebra 1 Worksheet
In this algebra worksheet, learners solve equations for y, graph the equations using the slope and y-intercept, and name four points on the line. There are 20 questions with their graphs.
Curated OER
Coordinate Geometry Battleship Lesson Plan
Students play a "Battleship" type of game to practice graphing on a coordinate plane. For this coordinate graphing lesson, students select a point on their grid to place their "battleship." It the opposing team misses the ship, the...
Curated OER
Coordinate Graphing
Students practice basic coordinate graphing and plotting points on the coordinate axis. In this geometry lesson, students are introduced to ordered pairs, and the x and y axis.
Curated OER
Cartesian Coordinate System
Students explore the Cartesian coordinate plane and plot points on the graph. They interpret coordinates for a point from the graph and give the ratio of rise over run for slope.
Curated OER
Graphing Inequalities
Students graph linear equations and then find the person in class whose linear equation graph is perpendicular to theirs. In this graphing inequalities lesson plan, students graph their perpendicular slopes and then once their find their...
Alabama Learning Exchange
We Love to Graph!
Students experience graphing points. In this graphing points lesson, students play an on-line game where they must name 10 coordinate pairs correctly. Students play a maze game where they maneuver a robot using coordinate pairs. ...
Curated OER
Graph Paper
Students are given pre-made graph paper. In this algebra lesson, students are given copies of graph paper that can be used to plot points on a coordinate plane already measured out.
Noyce Foundation
Granny’s Balloon Trip
Take flight with a fun activity focused on graphing data on a coordinate plane. As learners study the data for Granny's hot-air balloon trip, including the time of day and the distance of the balloon from the ground, they practice...
Concord Consortium
Function Project
What if a coordinate plane becomes a slope-intercept plane? What does the graph of a linear function look like? Learners explore these questions by graphing the y-intercept of a linear equation as a function of its slope. The result is a...
EngageNY
Constant Rate
Two-variable equations can express a constant rate situation. The lesson plan presents several constant rate problems. Pupils use the stated constant rate to create a linear equation, find values in a table, and graph the points. The...
Shodor Education Foundation
Multi-Function Data Flyer
Explore different types of functions using an interactive lesson. Learners enter functions and view the accompanying graphs. They can choose to show key features or adjust the scale of the graph.


