Curated OER
When Will We Ever Use This? Predicting Using Graphs
Here are a set of graphing lessons that have a real-world business focus. Math skills include creating a scatter plot or line graph, fitting a line to a scatter plot, and making predictions. These lessons are aimed at an algebra 1 level...
CPM
Tables, Equations, and Graphs
Eighth and ninth graders solve and graph 24 different problems that include completing input/output tables and graphing the pairs. First, they find the missing values for each table and write the rule for x. Then, students write the...
Curated OER
2D-Graphing Functions
Practice graphing basic equations. Algebra learners complete a table showing values of x and y. They graph the results on a coordinate grid. There are six problems: three equations are linear, and three are quadratic. The "show your...
Curated OER
Graphing Linear Equations
In this graphing linear equations worksheet, students plot 22 lines on their coordinate grids. When directions are followed carefully, the result is a picture.
Curated OER
Coordinate Graphing
Students practice basic coordinate graphing and plotting points on the coordinate axis. In this geometry lesson, students are introduced to ordered pairs, and the x and y axis.
Math Drills
Thanksgiving Cartesian Art: Mayflower
How did the Pilgrims arrive to America? Middle schoolers graph ordered pairs on a coordinate system, connect the points, and discover a mystery picture—the Mayflower.
Math Drills
Halloween Cartesian Art
Jack-o-lanterns are the face of Halloween. Middle school mathematicians graph coordinates on a cartesian plane and connect the points to create a jack-o-lantern.
Mathed Up!
Coordinates
Young graphers decide where to plot a point given a specific ordered pair. The problems vary in difficulty, beginning with simpler coordinates, and ending with plotting and connecting coordinates. Each graph is labeled with the...
West Contra Costa Unified School District
Graphing Piecewise Functions
Step up to learn about step functions. The lesson, designed for high schoolers, first covers piecewise functions and how to draw their graphs. It then introduces step functions, including the greatest integer (floor) and ceiling functions.
Charleston School District
Graphing Functions
How do letters and numbers create a picture? Scholars learn to create input/output tables to graph functions. They graph both linear and nonlinear functions by creating tables and plotting points.
Teach Engineering
Graphing Equations on the Cartesian Plane: Slope
Slopes are not just for skiing. Instructors introduce class members to the concept of slope and teach them how to calculate the slope from a graph or from points. The lesson also includes the discussion of slopes of parallel and...
Virginia Department of Education
Graphing Linear Equations
Combine linear equations and a little creativity to produce a work of art. Math scholars create a design as they graph a list of linear equations. Their project results in a stained glass window pattern that they color.
EngageNY
The Graph of a Linear Equation in Two Variables Is a Line
Show your class that linear equations produce graphs of lines. The 20th segment in a unit of 33 provides proof that the graph of a two-variable linear equation is a line. Scholars graph linear equations using two points, either from...
EngageNY
Every Line is a Graph of a Linear Equation
Challenge the class to determine the equation of a line. The 21st part in a 33-part series begins with a proof that every line is a graph of a linear equation. Pupils use that information to find the slope-intercept form of the equation...
EngageNY
Graphs of Simple Nonlinear Functions
Time to move on to nonlinear functions. Scholars create input/output tables and use these to graph simple nonlinear functions. They calculate rates of change to distinguish between linear and nonlinear functions.
Curated OER
Twenty-Seven Graphing Lines, Parabolas, and Absolute Value Problems
Have learners find coordinates of point on a graph, find equations of graphs given, and graph given equations using in and out tables. There are 27 problems related to equations for lines, parabolas, and absolute value functions.
Curated OER
Mapping a Site Using a Coordinate Plane
Learners map their playground as if it were an archeological site. They locate objects on the playground and determine their location using coordinate points. A related lesson is Coordinate Grid: Mapping an Archeological Site.
Marshall Cavendish International
Coordinate Plane Treasure Hunt
Similar to the game Battleship®, partners try and determine where the opponent buried their treasures on the hidden coordinate plane. Two types of planes are provided, one with only quadrant one and one with all four for a higher...
National Council of Teachers of Mathematics
Stitching Quilts into Coordinate Geometry
Who knew quilting would be so mathematical? Introduce linear equations and graphing while working with the lines of pre-designed quilts. Use the parts of the design to calculate the slope of the linear segments. The project comes with...
Curated OER
Coordinate Graphs, Translations and Reflections
Students perform translations and reflections. In this algebra lesson, students use the TI calculator to graph functions. They move the functions around on the coordinate plane using translation and reflection.
Curated OER
Tables and xy-Coordinates
Use this graphing functions activity to have learners complete four tables and graph the results on the included coordinate grid.
PHET
Graphing Lines
Ready to increase pupils' understanding of slope with an upward slope? Scholars use an interactive that allows users to move two points on a coordinate plane. The interactive then automatically calculates the slope, the slope-intercept...
Curated OER
Graph It
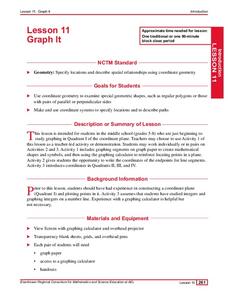
Elementary and middle schoolers engage in a lesson of graphing in quadrant I of the coordinate plain. They use the graph to create shapes and symbols. While using a graphing calculator, they locate the points on the coordinate plane. In...
Curated OER
Graphing Greenery
Young scholars gather leaves and trace them on graph paper. They plot coordinates that approximate the shape of the leaves and share those coordinates as "worksheets" for other students to complete.


