Scholastic
Study Jams! Tree Diagrams
With so many toppings to chose from, make the ice cream truck combinations a fun math problem that teaches your learners about outcomes. The video introduces a tree diagram that allows your mathematicians to see how to create...
EngageNY
Using Tree Diagrams to Represent a Sample Space and to Calculate Probabilities
Cultivate the tree of knowledge using diagrams with two stages. Pupils create small tree diagrams to determine the sample space in compound probability problems. The lesson uses only two decision points to introduce tree diagrams.
Corbett Maths
Tree Diagrams
Climb out on a branch to find probabilities. Using tree diagrams, the resource shows how to find compound probabilities when the events are not uniform. The video works through two different scenarios, one where the probabilities remain...
Curated OER
Data Analysis, Probability, and Discrete Math
Choose to supplement your probability unit with this resource and you won't be disappointed with the outcome. Teach young mathematicians to organize information using tree diagrams and lists in order to determine the possible outcomes of...
Curated OER
Investigation - Staci's New Car
Students study a shopping problem. They discuss strategies for determining the number of possible choices. They create a tree diagram and an organized list. Students analyze patterns and derive an equation for the multiplication principle.
EngageNY
Calculating Probabilities of Compound Events
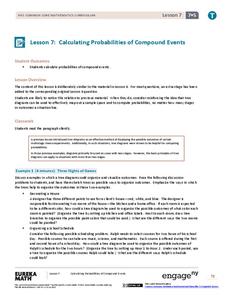
Use tree diagrams with multiple branches to calculate the probabilities of compound events. Pupils use tree diagrams to find the sample space for probability problems and use them to determine the probability of compound events in the...
Curated OER
Tree Diagrams
For this tree diagram worksheet, students read story problems. From the given information, they draw tree diagrams to determine the total possible number of outcomes. This one-page worksheet contains ten problems.
Curated OER
Tree Diagrams
In this tree diagrams instructional activity, students draw a tree diagram to represent a given situation. They identify the total number of outcomes. This one-page instructional activity contains 5 multi-step problems.
National Security Agency
It's Probably Probable
Learners make predictions and draw conclusions from given information as they learn the meaning of probability in this vocabulary-rich, integrated activity that presents a variety of teaching strategies to motivate and reach all learning...
Curated OER
Integrated Algebra Regents Questions: Combinations and Probability
For this combinations and probability worksheet, students solve 3 short answer problems. Students draw tree diagrams to represent possible outcomes in a sample space. Students determine the probability of an event.
Alabama Learning Exchange
Probability with Tree Diagrams
Middle school math whizzes view a PowerPoint tutorial on tree diagrams. Using "Anthonio's Pizza Palace," an interactive activity involving the selection of pizza toppings, they use Pascal's triangle as a tree diagram. This is an engaging...
CK-12 Foundation
Basic Counting Rules: Sandwich Shop
Young mathematicians make a tree diagram of all possibilities for sandwiches using an interactive. They learn how multiplication speeds up the process of finding the number of outcomes.
Virginia Department of Education
The Real Meal Deal
Burgers and salads and sodas, oh my! Scholars use a menu to investigate the Fundamental Counting Principle. They create tree diagrams to illustrate the number of possible choices for each given scenario.
Actis
Handling Data: Probability, Tree Diagrams
Clean, but captivating, two online simulations demonstrate probability for middle schoolers. They can choose the number of coins and tosses and watch as the results pile up. They can choose from a variety of spinner types and the number...
Shodor Education Foundation
Tree Diagrams and Probability
Aspiring statisticians create tree diagrams and figure probabilities of events based on those diagrams. They practice adding and multiplying fractions and explain complementary probabilities. Students use computers activities to make...
Noyce Foundation
Double Down
Double the dog ears, double the fun. Five problems provide increasing challenges with non-linear growth. Topics include dog ears, family trees and population data, and geometric patterns.
Curated OER
Data Management and Probability: Applications
In this data management and probability applications worksheet, 7th graders solve 13 different types of problems that include finding the mean, median, mode, and range of each set of values, as well as, solving a number of word problems....
Scholastic
Study Jams! Combinations
With so many combinations, this colorful video allows your learners to mathematically figure out how many options they have when purchasing t-shirts. One instructional activity teaches how to find out the combinations, and the second...
Curated OER
Probabilities for Number Cubes
Middle schoolers explore the concept of probability. In this probability lesson, students roll a six-sided number cube and record the frequency of each outcome. Middle schoolers graph their data using a frequency chart and keep tally...
Bowland
Counting Trees
Let's find a way to determine how many there are. Given a diagram of trees on a plantation, pupils devise a way to estimate the number of old and new trees. Using their methods, learners create estimates for the number of the two types...
Curated OER
Probability: Grade A
Math whizzes explore dependent and independent outcomes. They determine the outcome of simple and compound events. Pupils complete tree diagrams to identify outcomes. They identify fair and unfair games. This two-page worksheet contains...
College Preparatory Mathematics
Geometric Probability
In this geometric probability instructional activity, students solve and complete 12 different problems that include determining the outcomes of various types of probability. First, they use a tree diagram or an area model to compute the...
NY Learns
Investigation - What's in the Bag?
If you have or can create a set of tiles, numbered one through eight, then you can implement this hands-on lesson about probability models. Individuals draw a tile from a bag, record its number, and then return it to the bag. They...
Utah Education Network (UEN)
Probability and Statistics
MAD about statistics? In the seventh chapter of an eight-part seventh-grade workbook series, learners develop probability models and use statistics to draw inferences. In addition, learners play games and conduct experiments to determine...
Other popular searches
- Tree Diagrams Probability
- Math Tree Diagrams
- Tree Diagrams for Math
- Branching Tree Diagrams
- Tree Diagrams Dice Game
- Grammar Tree Diagrams
- Tree Diagrams Hurricanes
- Tree Diagrams and Probability
- Probability With Tree Diagrams
- Branching Out Tree Diagrams
- Outcomes and Tree Diagrams
- Tree Diagrams for Probability


