Curated OER
Survey of Height
For this data collection worksheet, students survey the heights of their fellow classmates, organize their data in a data table, and create a bar graph from their data. Once bar graph is completed, students complete 2 short answer...
Illustrative Mathematics
Two-School Dance
Who's ready for the dance? When two middle schools combine for a dance, your learners' job is to calculate the ratio of girls attending. Provided with three different solutions, you can choose from setting up a ratio, linear equation, or...
Illustrative Mathematics
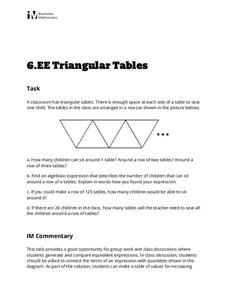
Triangular Tables
Somewhat of a puzzle, this problem gets pre-algebra preteens to write an expression representing a seating chart using triangle-shaped tables. This single task is an applicable lesson for meeting sixth grade Common Core math standards....
Education World
Putting Turkey on a Table (or a Graph)
Grateful learners put turkey on a table (or a graph)! Through a creative project they show statistical information about turkey population, production, and consumption. A great Thanksgiving lesson that can be applied at any time to the...
Beyond Benign
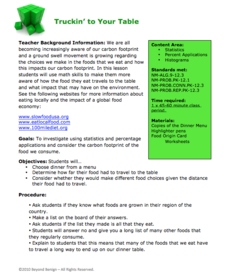
Truckin’ to Your Table
Food takes a trip to the table. Class members choose a meal from a menu and calculate the total cost of the meal including tax and tip. Using a food origin card, pupils determine how far each of the ingredients of a meal traveled to end...
Curated OER
Converting Units Of Length
Use this converting units of length worksheet to have your charges fill out a table, find the perimeters to three shapes and calculate the answers to three word problems.
Illustrative Mathematics
Cooking with the Whole Cup
Whoops! Travis accidentally put too much butter into the recipe. Your bakers must find out how to alter the recipe to accommodate different changes by using unit rates and ratios . The activity has multiple parts and calculations with...
Buffalo-Hanover Montrose Schools
Histogram Worksheet
Young mathematicians analyze a given set of numbers to complete a frequency table, and then make a histogram using the data. The worksheet includes three sets of data on the worksheet.
Achieve
False Positives
The test may say you have cancer, but sometimes the test is wrong. The provided task asks learners to analyze cancer statistics for a fictitious town. Given the rate of false positives, they interpret the meaning of this value in the...
California Education Partners
T Shirts
Which deal is best? Learners determine which of two companies has the best deal for a particular number of shirts. They begin by creating a table and equations containing each company's pricing structure. Individuals finish the seventh...
Noyce Foundation
Ducklings
The class gets their mean and median all in a row with an assessment task that uses a population of ducklings to work with data displays and measures of central tendency. Pupils create a frequency chart and calculate the mean and median....
CK-12 Foundation
Bar Graphs, Frequency Tables, and Histograms: Comparing Heights
Become a master at creating visual displays. Using a provided list of heights, users of the interactive create a bar graph and a histogram. They answer a set of challenge questions based on these data representations.
Curated OER
Using A Table
In this table worksheet, middle schoolers observe information in a table, and then answer ten questions pertaining to the information. They must correctly read a table in order to arrive at the correct answer. Questions pertain to...
Curated OER
Creating Frequency Tables
For this frequency table worksheet, students explore a given set of numbers. They group the data and create a frequency table. This one-page worksheet contains ten problems.
Curated OER
Seven Rates and Ratio Problems Using Tables
In this rates and ratios worksheet, students complete tables given rates. This worksheet contains seven multi-part problems where students discover the steps to ratio problems.
Curated OER
Frequency Histograms, Bar Graphs and Tables #3
In this frequency histograms worksheet, students examine bar graphs, histograms and tables. They identify the model of information that best matches the statistics. This three-page worksheet cotnains two multiple-choice problems. ...
Curated OER
Table Readings
For this table worksheet, students read questions and interpret tables. Questions include information concerning unemployment, oil imports, and foreign students. This multiple-choice worksheet contains 10 problems. Answers are provided.
Curated OER
The Number Table Problem
In this number table problem, students explore tables and determine the number pattern. This one-page activity contains 1 problem. Answers are provided at the bottom of the page.
Curated OER
Mean, Median, and Mode for Frequency Tables
In this mean, median, and mode worksheet, students solve 10 short answer problems. Students find the mean, median, and mode of various data sets. Students make frequency tables from the data sets.
Curated OER
Frequency Table
In this frequency table worksheet, students create a frequency table from given data. They identify the mode. Students read and interpret frequency tables. This one-page worksheet contains 7 multi-step problems.
Curated OER
Students Favorites
Students complete activities using a frequency table and construct a pie graph for the data. In this frequency table lesson, students complete a survey to find data for a frequency table. Students use the given link to make a pie graph...
EngageNY
Sampling Variability
Work it out — find the average time clients spend at a gym. Pupils use a table of random digits to collect a sample of times fitness buffs are working out. The scholars use their random sample to calculate an estimate of the mean of the...
CK-12 Foundation
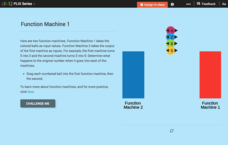
Function Rules for Input-Output Tables: Function Machine 1
Challenge your classes to find the pattern of a double function machine. After recording the outputs of both machines, learners identify the pattern and the corresponding function. Both patterns involve adding/subtracting a constant.
CK-12 Foundation
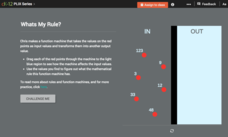
Function Rules for Input-Output Tables: Whats My Rule?
What's the rule that makes it true? A virtual function machine generates output values as learners submit the input values. Their job is to analyze the inputs and outputs for a pattern and write a function rule.
Other popular searches
- Multiplication Tables
- Math Tables and Tools
- Function Tables
- Input/output Tables
- Multiplication Tables 1 100
- Frequency Tables
- Input Output Tables
- +Math Tables Tips Tools
- Data Tables
- Tables, Charts and Graphs
- Multiplication Tables Songs
- Frequency Tables Line Plots


