Bowland
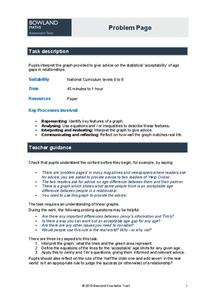
Problem Page
Future mathematicians use a given graph to answer a question about age differences in relationships. Along the way, they must find the equation and inequality of given graphs.
Curated OER
Snowflake Curve
Young scholars develop an appreciation for complex structures in nature. They observe patterns in nature in relationship to the Real World. Students use observation skills to assist in problem solving. They show comprehension of the...
Curated OER
Baseball Relationships - Using Scatter Plots
Students use graphing calculators to create scatter plots of given baseball data. They also determine percentages and ratios, slope, y-intercepts, etc. all using baseball data and statistics.
Curated OER
English Exercises: Family Tree
In this English exercises: family tree worksheet, 7th graders interactively complete the family tree with the help of 10 clues listed, using logic to determine the relationships, with immediate online feedback.
Curated OER
Exploring Slope
In this exploring slope learning exercise, students solve and complete 4 different problems. First, they compare an object's weight on Earth to an object's weight on another planet using the information given. Then, students compare this...
Teach Engineering
Windy Tunnel
Lift—it is about the wing's attack. Using a virtual wind tunnel, pupils investigate wing shape and angle of attack. Learners use worksheets to record their observations and to convert verbal relationships into mathematical equations in...
PBS
From Patterns of Input and Output to Algebraic Equations
Watch video clips titled, "Frog Hops Part I" and "Frog Hops Part II," then discuss patterns demonstrated in the videos. Learners will complete an algebraic expressions and equations handout and discuss the answers. They will be able to...
Curated OER
Interpreting Graphs
Sixth graders interpret linear and nonlinear graphs. They create graphs based on a problem set. Next, they represent quantitive relationships on a graph and write a story related to graphing.
American Statistical Association
Exploring Geometric Probabilities with Buffon’s Coin Problem
Scholars create and perform experiments attempting to answer Buffon's Coin problem. They discover the relationships between geometry and probability, empirical and theoretical probabilities, and area of a circle and square.
Illustrative Mathematics
Function Rules
Function machines are a great way to introduce the topic of functions to your class. Here, you will explore the input and output to functions both using numerical and non-numerical data. Learners are encouraged to play with different...
Illustrative Mathematics
Reasoning about Multiplication and Division and Place Value, Part 1
Help your class make sense of quantities and their relationships. Given is the product of two numbers. It is up to your number crunchers to think about the quantitative relationship when the product is one-tenth or ten times the product...
Curated OER
US Airports, Assessment Variation
Determining relationships is all part of algebra and functions. Your mathematicians will decide the type of relationship between airports and population and translate what the slope and y-intercept represent. The problem is multiple...
Utah Education Network (UEN)
Geometric Figures and Scale Drawings
Scale up your lessons on geometry and ask learners to investigate conditions on triangles, scale drawings, the area and circumference of circles, and angle relationships. The resource includes activities and a homework assignment.
Mathematics Assessment Project
Shelves
Don't leave this task on the shelf — use it is assess middle schoolers understanding of patterns. Participants try to discover a pattern in the number of bricks and planks used to make shelves. They then match descriptions and equations...
Education Development Center
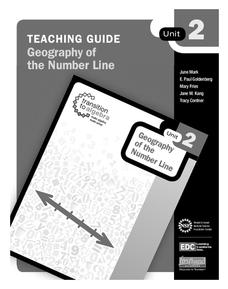
Geography of the Number Line
It's more than just numbers on a line, its an organizational, mental math machine to help learners understand the value of numbers. The tool is handy when introducing positive and negative integers to see their values and relationships....
Balanced Assessment
Smaller, Larger, In-Between
Build a solid understanding of rational number relationships by asking class members to use various skills to order decimals, fractions, and numeric power expressions. Using the resource, they find that the fractions do not have an...
EngageNY
End-of-Module Assessment Task: Grade 7 Mathematics Module 6
Determine the level of understanding within your classes using a summative assessment. As the final lesson in a 29-part module, the goal is to assess the topics addressed during the unit. Concepts range from linear angle relationships,...
Noyce Foundation
Piece it Together
Score some problems all related to soccer balls. The first few problems focus on pattern blocks to see relationships between figures. More advanced problems focus on actual soccer balls, the patterns on the balls, and their volumes and...
CK-12 Foundation
Function Rules for Input-Output Tables: Soda Sugar Function Table
Examine the relationship between the input and output variables in a table of values. As learners build an input-output table using online manipulatives, they begin to identify patterns. They answer questions about these patterns and...
Concord Consortium
Integer Solutions
Experiment with integer relationships. Young scholars consider integers that have a sum of 10. They begin with two integers, then three, four, and more. As they consider each situation, they discover patterns in the possible solutions.
Curated OER
A Special Relationship
Students discover the relationships of the lengths of the sides of right triangles and right triangles using a series of drawings on dot paper. They investigate and solve problems of standard (customary and metric units) and non-standard...
Curated OER
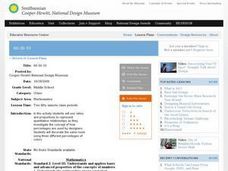
60-30-10
Students use ratios and proportions to represent quantitative relationships as they investigate the concept of how percentages are used by designers. Students decorate the same room using three different percentages of colors.
Curated OER
Web Adventure -- Oakland to Chicago Flight
Students develop an awareness of mathematics in a diverse number of careers, then describe three duties of a pilot that require mathematical skills. They increase understanding of interpreting data relationships presented in table format.
Curated OER
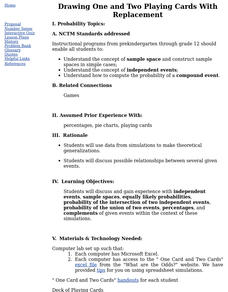
Drawing One and Two Playing Cards With Replacement
Math whizzes use data from simulations to make theoretical generalizations and discuss possible relationships between several given events. They use a simple card game to generate data to be analyzed.
Other popular searches
- Healthy Relationships
- Interpersonal Relationships
- Linear Relationships
- Quadratic Relationships
- Ecological Relationships
- Family Relationships
- Symbiotic Relationships
- Angle Relationships
- Family Health Relationships
- Economic Relationships
- Cause and Effect Relationships
- Relationships Among Organisms


