Curated OER
Data Squares
Middle and high schoolers examine how data squares organize and sort information and data sets. They discuss examples of data squares, complete a data square about themselves, organize the data squares for the class together, and compile...
Curated OER
Organizing Data
In this organizing data worksheet, 7th graders solve seven different types of problems related to data. They first identify the type of data as categorical, discrete or continuous from the information given. Then, students use Excel to...
Curated OER
Data Analysis and Froot Loops
Use this probability and graphing lesson to have your learners work with a partner to make a necklace out of Froot Loops. They record the cereal colors randomly chosen and strung, graph their data, then use a ratio formula to determine...
CK-12 Foundation
Frequency Tables to Organize and Display Data: Favorite Films
What information can your class determine if they know the number of people attending movie showings? Using the information about the number of people at each screening, learners develop a frequency table. The pupils analyze the type of...
Curated OER
Organising Data
Students complete data organization activities. In this data organization lesson plan, students watch online clips about organizing data. Students complete an eye color frequency table for their class. Students watch a clip about asking...
Curated OER
What's My Pattern?
Students recognize, describe and extend patterns in three activities. They organize data, find patterns and describe the rule for the pattern as well as use the graphing calculator to graph the data to make and test predictions. In the...
Curated OER
Student Costs Data Table
Students compare and contrast two routes selected for a virtual field trip. They create a data table of educational activities, lodging, and meal costs using Microsoft Excel software.
Curated OER
Data Handling
In this data handling worksheet, students interpret data found in table, graphs and charts. They organize data and draw bar charts. This two-page worksheet contains 2 multi-step problems.
Curated OER
Mean, Median, Mode, Range
Learners engage in a study of mean, median, mode, and range in order to represent data in tables. They are also exposed to the results of data that is skewed because of the outlier.
American Statistical Association
Don't Spill the Beans!
Become a bean counter. Pupils use a fun activity to design and execute an experiment to determine whether they can grab more beans with their dominant hand or non-dominant hand. They use the class data to create scatter plots and then...
Raytheon
Data Analysis and Interpretation
For this data analysis and interpretation worksheet, learners use charts, graphs, statistics to solve 42 pages of problems with answer key included.
Curated OER
Dealing With Data
Students collect, organize, and display data using a bar graph, line graph, pie graph, or picture graph. They write a summary describing the data represented and compare the graph to another graph in the class.
Curated OER
Survey of Height
In this data collection instructional activity, students survey the heights of their fellow classmates, organize their data in a data table, and create a bar graph from their data. Once bar graph is completed, students complete 2 short...
Curated OER
State Names: Frequency
Data grathers determine the frequency of specified data. They identify the frequency that specified letters occur in the names of all 50 states. They create stem-and-leaf plots, box-and-whisket plots and historgrams to illustrate the data.
EngageNY
The Difference Between Theoretical Probabilities and Estimated Probabilities
Flip a coin to determine whether the probability of heads is one-half. Pupils use simulated data to find the experimental probability of flipping a coin. Participants compare the long run relative frequency with the known theoretical...
Virginia Department of Education
Numbers in a Name
What's in a name? Pupils create a data set from the number of letters in the names of classmates. Each group then takes the data and creates a visual representation, such as a histogram, circle graph, stem-and-leaf plot, etc.
Mathed Up!
Stem and Leaf Diagrams
Order the data within a stem-and-leaf display. Pupils take data and create and ordered stem-and-leaf diagrams, including the key. Participants take their data and determine answers about the information. Class members then find measures...
Curated OER
How Tall is the Average 6th Grader?
Upper grade and middle schoolers explore mathematics by participating in a measuring activity. They hypothesize on what the average height of a male or female 6th grader is and identify ways to find the average mathematically. Learners...
Curated OER
What is the Best Chip?
Scholars collect data about chips. They pick their favorite type of chip from a given variety such as potato chips, tortilla, or banana chips. Then they write on an index card their favorite chip and why it's their favorite. They also...
101 Questions
Shipping Routes
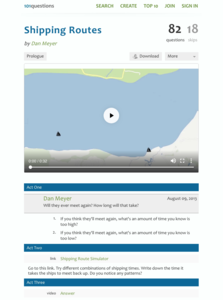
The product of the hard work is learning. Scholars use a simulation tool to collect information to analyze. They must decide when two ships traveling back and forth across a river at different rates will meet on the same side. The intent...
Curated OER
Organizing and Interpreting Data
In this organizing and interpreting data worksheet, students solve and complete 10 different problems related to reading various data tables. First, they complete the 3 charts shown with the correct tally amount, frequency amount, and...
Curated OER
Use or Make a Table
In this use or make a table worksheet, young scholars examine data given in a story problem. They use logic to determine the best way to begin organizing the data and creating a table. This one-page worksheet contains three problems. ...
Curated OER
Raisin the Statistical Roof
Use a box of raisins to help introduce the concept of data analysis. Learners collect, analyze and display their data using a variety of methods. The included worksheet takes them through a step-by-step analysis process and graphing.
Curated OER
Box Plots
Young statisticians are introduced to box plots and quartiles. They use an activity and discussion with supplemental exercises to help them explore how data can be graphically represented.


