Curated OER
Make a Frequency Table and a Histogram for a Given Set of Data
In this data recording and data organization worksheet, students create one frequency table and one histogram for a given list of data. Explanations and examples for frequency tables and histograms are given.
Curated OER
Frequency Tables and Stem-and-Leaf Plots
Students are introduced to the function of frequency tables and stem and leaf plots. In groups, they determine the frequency of their teacher coughing, ringing a bell or raising their hand. To end the lesson plan, they determine...
Curated OER
Mean, Median, and Mode for Frequency Tables
In this mean, median, and mode worksheet, students solve 10 short answer problems. Students find the mean, median, and mode of various data sets. Students make frequency tables from the data sets.
Buffalo-Hanover Montrose Schools
Histogram Worksheet
Young mathematicians analyze a given set of numbers to complete a frequency table, and then make a histogram using the data. The worksheet includes three sets of data on the worksheet.
Curated OER
Creating Frequency Tables
In this frequency table worksheet, learners explore a given set of numbers. They group the data and create a frequency table. This one-page worksheet contains ten problems.
Curated OER
Students Favorites
Students complete activities using a frequency table and construct a pie graph for the data. In this frequency table lesson plan, students complete a survey to find data for a frequency table. Students use the given link to make a pie...
Curated OER
Dot Plots
Number crunching statisticians explore displaying data with dot plots and define the difference between quantitative data and qualitative data. Dot plots are created based on a set of given data and analyzed.
Curated OER
Data Collection and Presentation
Middle and high schoolers collect and analyze data from four different activities. The activities include information about classmates, tallying colors of cars in a parking lot, stem and leaf plots, and making a histogram from winning...
Curated OER
Frequency Tables
Seventh graders construct frequency tables and box-and-whisker plots. After constructing tables and plots, they take a quiz on mean, median, mode, range, scientific notation, and number properties.
Curated OER
Histograms
In this histograms instructional activity, students solve 5 word problems based on a histogram of presidential ages at their inauguration. Next, students create a frequency table and a histogram based on a list of data which shows the...
Noyce Foundation
Ducklings
The class gets their mean and median all in a row with an assessment task that uses a population of ducklings to work with data displays and measures of central tendency. Pupils create a frequency chart and calculate the mean and median....
Curated OER
Dealing with Data
Seventh graders collect and analyze data. In the seventh grade data analysis lesson, 7th graders explore and/or create frequency tables, multiple bar graphs, circle graphs, pictographs, histograms, line plots, stem and leaf plots, and...
Concord Consortium
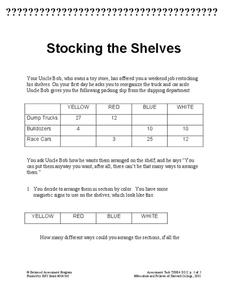
Stocking the Shelves
How many ways can you stock a shelf? It's probably more than you think! Young scholars use data in a frequency table to determine how many ways to stock a shelf given a specific constraint for types of groups. They then repeat the task...
Curated OER
What's the Frequency, Roy G. Biv?
Introduce starting space scientists to the electromagnetic spectrum, expecially the portion of visible light. Teach them about wavelength and frequesncy. Then give them a roll of adding machine tape and a manila folder to make a...
West Contra Costa Unified School District
Introduction to Conditional Probability
Here is a turnkey lesson that walks young statisticians through the development and uses of conditional probability. From dice games to surveys, Venn diagrams to frequency tables, the class learns how a given can effect the overall...
Bowland
German or English?
Sprechen sie Deutsch? Future cryptographers must decide whether an unknown text is written in English or in German. They use provided pie charts about the frequency of words in the English and German languages to help make their decisions.
Curated OER
Frequency Histograms, Bar Graphs and Tables #3
In this frequency histograms activity, students examine bar graphs, histograms and tables. They identify the model of information that best matches the statistics. This three-page activity cotnains two multiple-choice problems. ...
EngageNY
The Difference Between Theoretical Probabilities and Estimated Probabilities
Flip a coin to determine whether the probability of heads is one-half. Pupils use simulated data to find the experimental probability of flipping a coin. Participants compare the long run relative frequency with the known theoretical...
Shodor Education Foundation
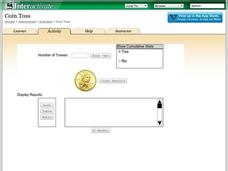
Coin Toss
Are your young mathematicians having a hard time making heads or tails of probabilities? It's no toss up—here is a resource that's sure to straighten them out! Learners run the interactive to toss a coin a different number of times....
Curated OER
Math Regents Exam Questions - Pearson Integrated Algebra P.304: Histograms
In this histograms instructional activity, students solve 9 short answer, multiple choice, and graphing problems. Students construct frequency tables and histograms of data.
Mathematics Assessment Project
Suzi's Company
Don't use an average resource ... use this one. As a middle school assessment task, learners first determine mean, median, and mode of salaries given in a frequency table. They then investigate how a change in one value changes the...
Curated OER
Range, Cluster, Gap and Outliers
There are a number of activities here where learners collect and record data, as well as, activities where the likelihood of an event happening is calculated given the experimental probability. Young statisticians organize information...
Curated OER
Cumulative Frequency
In these word frequency worksheets, students choose a page from a newspaper and count the number of letters in each word and complete their results in a table. Students then calculate the mean number of letters. Students then collect...
Mathed Up!
Histograms
Class members explore how to read and use histograms by watching a video on creating and analyzing histograms. To finish, the class works on a set of questions that tests these skills.


