Curated OER
Graphing Stories Ice Breaker
Kick off the school year with some math fun! New classmates share information about themselves by using graphs and interpreting data. The goal is to use a general graph shape, such as linear or exponential, and create labels for the axes...
Shasta County Office of Education
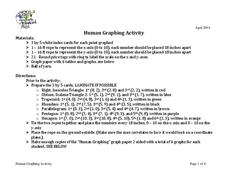
Human Graphing Activity
Take graphing outside and make a giant coordinate plane to plot your human points. Young graphers are each given a coordinate for a particular shape and asked to make the geometrical shapes one by one. Those not plotted are to write down...
Scholastic
Study Jams! Choosing the Correct Graph
With so many types of graphs, don't let your learners get stuck figuring out which one to use. To track how Zoe spent her allowance, use this interactive lesson to review all the types of graphs and pick the best one to display the data....
Mathematics Assessment Project
Linear Graphs
A line is a line is a line. As a middle school assessment task, learners first identify graphs of given linear equations. They then identify the equations that represent real-world situations.
Curated OER
Identifying Linear Functions from Graphs
Keep your mathematicians engaged using this group linear functions activity. Each of ten groups receives two graphs with both an image and equation, as well as a "who has" phrase to call out the next graph. Scholars stay on their toes as...
Mathematics Assessment Project
Interpreting Distance–Time Graphs
Pre-algebra protégés critique a graph depicting Tom's trip to the bus stop. They work together to match descriptive cards to distance-time graph cards and data table cards, all of which are provided for you so you can make copies for...
Wordpress
Equation Table Graph
Your Algebra learners will appreciate this fabulous, two-page printable. The first page has a list of numbers that lead to the learners writing an equation in a cloud that represents these numbers, and then filling in a table, and...
Curated OER
What's in a Graph?
How many yellow Skittles® come in a fun-size package? Use candy color data to construct a bar graph and a pie chart. Pupils analyze bar graphs of real-life data on the Texas and Massachusetts populations. As an assessment at the end of...
Scholastic
Study Jams! Double-Line Graphs
With two summers of babysitting money, Mia needs a way to compare her earning from both years. Show your learners that they can organize the data onto a double-line graph to easily compare which summer was more profitable. The lesson...
CK-12 Foundation
Single Bar Graphs: Cupcakes
What is a little cake among friends? Given the relationship between the number of cupcakes five friends have, pupils create a bar graph. The learners answer questions about the graph and adjust the graph if one friend shares some of his...
Curated OER
Graph It!
There is more than one way to represent data! Learners explore ways to represent data. They examine stacked graphs, histograms, and line plots. They conduct surveys and use stacked graphs, histograms, or line plots to chart the data they...
Curated OER
Data Analysis and Probability: Graphing Candy with Excel
Collect and graph data using Microsoft Excel with your math class. They will make predictions about the number of each colored candy in a bag of M&M's, then sort, classify, count, and record the actual data before using Excel to...
Curated OER
Bar Graphs and Survey Questions- Internet Access
In this graphing and data collection activity, students examine a bar chart that show data collected from 1998 - 2006 that shows the percentage of households that have Internet access. They answer questions based on the chart and make...
Curated OER
Graphing Lines That Don't "Fit"
How can you graph lines that don't seem to fit on the given graph? What makes a line straight? What does the rate of change mean when graphing a line? How do you know if a slope is positive or negative? How do you know if the graph of a...
CK-12 Foundation
Line Graphs to Display Data Over Time: Strawberry Competition
Take the tediousness out of graphing. Using the interactive tool, learners can efficiently create a line graph from a set of data. They then use the graph to answer questions about specific trends in the data.
Curated OER
What's in a Graph?
Students explore how to use and interpret graphs. The graphs are pulled from a variety of sources, and the activities ask students to interpret graphs. They start this lesson with knowledge of what a graph is. Students also know how to...
Curated OER
Correlation of Variables by Graphing
Middle and high schoolers use a spreadsheet to graph data. In this graphing lesson, learners determine how two parameters are correlated. They create a scatter plot graph using a computer spreadsheet.
Curated OER
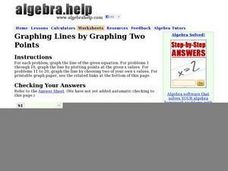
Graphing Lines by Graphing Two Points
Use a graphing lines worksheet to have your mathematicians graph the line of a given equation and plot specified points. The first 10 problems have a given equation, and two values. The next 10 problems have a given equation, but your...
CK-12 Foundation
Double Bar Graphs: Favorite Cookies Chart
It's just the way the cookie crumbles. Using the data from a class poll, learners create a double bar graph showing favorite cookie types. The pupils compare favorites between boys and girls with the aid of their graphs, then they make...
CK-12 Foundation
Broken-Line Graphs: Heating Curve of Water
Examine the unique graphs coined broken-line graphs. Using the phase change of water for data, learners answer questions related to the temperature and energy at different times in the cycle of the phase change. Questions focus on the...
CK-12 Foundation
Single Bar Graphs: Hockey Teams
Raise the bar for hockey fans. Using data about favorite hockey teams, pupils build a bar graph. They use the information from the graph to make comparisons and solve one- and two-step problems.
CK-12 Foundation
Multiple Line Graphs: Jack's Jumpshot
What are the advantages to seeing multiple data sets on the same graph? Scholars explore this question as they manipulate the animation within the lesson. Questions within the interactive ask individuals to make comparisons across the...
Curated OER
Create a Graph Online
Scholars create colorful bar, line, or pie graphs. They decide on a survey question to ask or a type of data to gather. From there, they collect information and data. They display this data in bar, line, or pie graphs that they create...
Curated OER
A Picture is Worth a Thousand Words: Introduction to Graphing
Students practice graphing activities. In this graphing lesson plan, students discuss ways to collect data and complete survey activities. Students visit a table and graphs website and then a create a graph website to practice graphing.
Other popular searches
- Charts and Graphs
- Bar Graphs
- Line Graphs
- Double Bar Graph
- Circle Graphs
- Pie Charts and Graphs
- Picture Graphs
- Coordinate Graphs
- Skittles Bar Graph
- Reading Charts and Graphs
- Blank Coordinate Graphs
- Percent Circle Graph


