Scholastic
Study Jams! Tree Diagrams
With so many toppings to chose from, make the ice cream truck combinations a fun math problem that teaches your learners about outcomes. The video introduces a tree diagram that allows your mathematicians to see how to create...
EngageNY
Using Tree Diagrams to Represent a Sample Space and to Calculate Probabilities
Cultivate the tree of knowledge using diagrams with two stages. Pupils create small tree diagrams to determine the sample space in compound probability problems. The lesson uses only two decision points to introduce tree diagrams.
Corbett Maths
Tree Diagrams
Climb out on a branch to find probabilities. Using tree diagrams, the resource shows how to find compound probabilities when the events are not uniform. The video works through two different scenarios, one where the probabilities remain...
Mathed Up!
Stem and Leaf Diagrams
Order the data within a stem-and-leaf display. Pupils take data and create and ordered stem-and-leaf diagrams, including the key. Participants take their data and determine answers about the information. Class members then find measures...
CK-12 Foundation
Venn Diagrams: Planets and Dwarf Planets of the Solar System
Yes, Venn diagrams are helpful in science, too. Learners use an interactive to classify celestial bodies as having moons, as dwarf plants, as both, or as neither. They answer a set of challenge questions based on the Venn diagrams they...
CK-12 Foundation
Venn Diagrams: T-Shirt Mystery
Sorting your t-shirts is easy with Venn diagrams. Individuals use a drag and drop interactive to classify shapes on t-shirts into Venn diagrams. A set of challenge questions tests whether the classification is correct.
Curated OER
Data Analysis, Probability, and Discrete Math
Choose to supplement your probability unit with this resource and you won't be disappointed with the outcome. Teach young mathematicians to organize information using tree diagrams and lists in order to determine the possible outcomes of...
Curated OER
Investigation - Staci's New Car
Students study a shopping problem. They discuss strategies for determining the number of possible choices. They create a tree diagram and an organized list. Students analyze patterns and derive an equation for the multiplication principle.
Curated OER
Building Venn Diagrams
Students use Venn diagrams to solve prime number and factorization problems. In this multiplication lesson, students watch a video and use a Venn Diagram to help them solve a pizza math activity that uses prime factorization. Students...
Curated OER
Presentation of Quantitative Data- Vertical Line Diagrams
In this quantitative data worksheet, students examine how vertical line diagrams can be used to display discrete quantitative data. They read about the use of tally charts to create vertical line graphs that display the data. They...
Curated OER
Answer the Questions Based on the Venn Diagram
In this Venn diagram worksheet, students answer 6 questions about a Venn diagram. Students determine the number of students who like soccer and tennis.
EngageNY
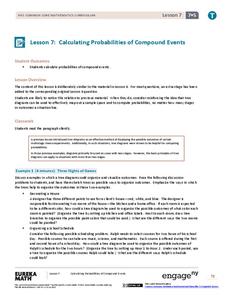
Calculating Probabilities of Compound Events
Use tree diagrams with multiple branches to calculate the probabilities of compound events. Pupils use tree diagrams to find the sample space for probability problems and use them to determine the probability of compound events in the...
Curated OER
Tree Diagrams
For this tree diagram worksheet, students read story problems. From the given information, they draw tree diagrams to determine the total possible number of outcomes. This one-page worksheet contains ten problems.
Curated OER
Using Diagrams in Problem Solutions
Students use tables, graphs and diagrams to collect data. In this problem solving with diagrams lesson plan, students construct their own tables and graphs containing information they gather from a drawing. They also make a Venn Diagram...
Curated OER
Sets an the Venn Diagram
Learners explore the characteristics of sets and Venn Diagrams. Given data, students practice determining the placement of elements in a Venn Diagram. Learners discuss the correspondence between data sets and their graphical...
Curated OER
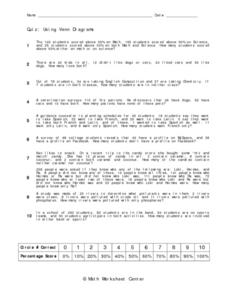
Using Venn Diagrams
In this Venn Diagrams worksheet, students complete and draw 10 different Venn Diagrams to match each problem as described. First, they determine the number of kids who scored above half on math or science. Then, students compare the...
Curated OER
Tree Diagrams
In this tree diagrams instructional activity, students draw a tree diagram to represent a given situation. They identify the total number of outcomes. This one-page instructional activity contains 5 multi-step problems.
Curated OER
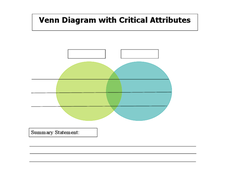
Venn Diagram with Critical Attributes
In this Venn diagram graphic organizer worksheet, students compare and contrast an item using the overlapping diagram. Students also list critical attributes in the space provided.
Curated OER
Problem Solving with Diagrams, Part One
In this diagrams worksheet, students use diagrams to help them solve fraction word problems. Students complete 4 problems on this worksheet.
Curated OER
Put Your Habits to Work in Math
Learning how to read an expository text is an essential skill. The questions on this two-page worksheet lead pupils to understand that the title, heading, diagrams, photographs, problems and captions all support the main idea of a...
National Security Agency
It's Probably Probable
Learners make predictions and draw conclusions from given information as they learn the meaning of probability in this vocabulary-rich, integrated activity that presents a variety of teaching strategies to motivate and reach all learning...
Curated OER
Venn Diagram-Two Circles
In this Venn Diagram worksheet, students analyze the union, intersection, and subtraction of three sets of Venn Diagrams.
Curated OER
Quantitative Data
In this quantitative data worksheet, pupils compute measures of central tendency, draw vertical line diagrams, and compare collected data. This 23-page worksheet contains approximately 100 multi-step problems. Explanations and examples...
Curated OER
Integrated Algebra Regents Questions: Combinations and Probability
For this combinations and probability worksheet, students solve 3 short answer problems. Students draw tree diagrams to represent possible outcomes in a sample space. Students determine the probability of an event.
Other popular searches
- Sets and Venn Diagrams
- Venn Diagrams
- Tree Diagrams
- Lewis Dot Diagrams
- Energy Transfer Diagrams
- Algebra 1 Venn Diagrams
- Human Body Anatomy Diagrams
- Math Venn Diagrams
- Electron Dot Diagrams
- Blank Venn Diagrams
- Ray Diagrams
- Carroll Diagrams


