Curated OER
Student Costs Graph
Young scholars calculate the mileage, gasoline costs, and travel time and costs for a vacation. They conduct a virtual field trip, and create a comparison graph of costs using Microsoft Excel software.
Curated OER
Data Handling
In this data handling worksheet, students interpret data found in table, graphs and charts. They organize data and draw bar charts. This two-page worksheet contains 2 multi-step problems.
Curated OER
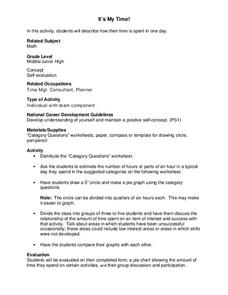
It's My Time!
Students create a pie chart. In this time lesson, students determine the amount of time they spend on given activities. They create a pie chart diagraming the data. Students share their graphs with the class.
Curated OER
The Numbers Tell the Story
Students demonstrate how to gather and interpret statistical data. For this data analysis lesson, students search for statistics on the health effects of smoking and place the information into charts. Students create these charts online...
Curated OER
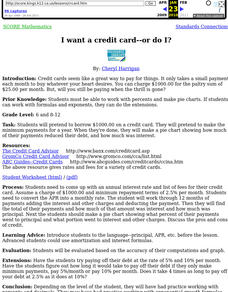
I want a credit card--or do I?
Students pretend to borrow $1000.00 on a credit card. They pretend to make the minimum payments for a year. When they're done, they make a pie chart showing how much of their payments reduced their debt, and how much was interest.
Curated OER
Time Management: Piece of Pie
Students examine their own lives and how well they manage their time outside of school. In this this time management lesson, students discover the amount of time they spend on other activities, and create a pie chart with that...
Curated OER
Creating Circles
Students make a circle graph. In this graphing lesson, the teacher conducts a class survey, then demonstrates how to make a pie graph. When students are comfortable with the material, they use a worksheet to create their own graph.
Curated OER
Organizing Data
In this organizing data worksheet, 7th graders solve seven different types of problems related to data. They first identify the type of data as categorical, discrete or continuous from the information given. Then, students use Excel to...
Curated OER
EXCEL It!
Students surf the Web gathering information about graphs. The data collected is incorporated into an Excel spreadsheet and graphs of varying nature generated to further enhance student understanding.
Curated OER
What's My Pattern?
Students recognize, describe and extend patterns in three activities. They organize data, find patterns and describe the rule for the pattern as well as use the graphing calculator to graph the data to make and test predictions. In the...
Curated OER
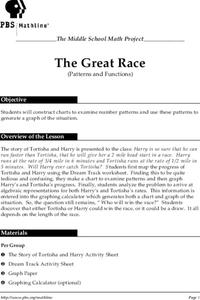
The Great Race
Learners are presented with a story about two individuals running a race in which one is given a head start. Students must map the progress of the runners, create a chart examining patterns and graph the progress. In the end, learners...
Curated OER
Froot Loops to the Max- Pie 2
In this Froot Loops to the Max worksheet, students solve 2 different problems related to graphing data with a box of Froot Loops cereal. First, they complete the circle/pie graph using the given data including a key and a title for their...
Yummy Math
US Holiday Candy Sales
Candy is a big business! Calculate the amount of money consumers spent on major holidays—Easter, Halloween, Christmas, Hanukkah, and Valentine's Day—based on the total amount of candy sales from 2011 and the percentage of each holiday's...
Raytheon
Data Analysis and Interpretation
For this data analysis and interpretation worksheet, learners use charts, graphs, statistics to solve 42 pages of problems with answer key included.
Curated OER
Skittle it Up
Young scholars make a graph. In this graphing and Excel lesson, students work in groups and are given a bag of skittles. Young scholars count the number of each color skittle and create a table in Excel. Students learn how to make a pie...
Curated OER
Using Excel To Teach Probability And Graphing
Young scholars engage in the use of technology to investigate the mathematical concepts of probability and graphing. They use the skills of predicting an outcome to come up with reasonable possibilities. Students also practice using a...
Curated OER
Percents Practice
In this decimals worksheet, students complete problems involving decimals, percents, fractions, word problems, and charts. Students complete 72 problems total.
Curated OER
Graph and Compare the Adventure's Temperature Vs. Local Temperature
Pupils explore the concept graphing data. In this graphing data lesson, students use weather data from their local weather and some other city and graph them. Pupils plot the local weather vs. another city. Students record temperature...
Curated OER
Bald Eagle Population Graphing
Pupils create graphs to illustrate the bald eagle population. They identify the population of bald eagles in Minnesota and the United States. They create three graphs to represent the population data including a line, bar, and...
PBS
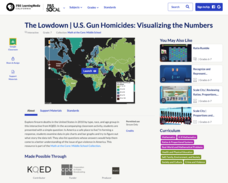
The Lowdown — U.S. Gun Homicides: Visualizing the Numbers
Is gun violence a big issue in America? Pupils explore gun deaths by type, race, and age group in a Math at the Core: Ratios interactive. The class tries to determine whether America is a safe place to live and use bar graphs and pie...
Curated OER
Data Collection and Presentation
Middle and high schoolers collect and analyze data from four different activities. The activities include information about classmates, tallying colors of cars in a parking lot, stem and leaf plots, and making a histogram from winning...
Bowland
Ice Cream
Make sure there is enough ice cream on hand. Learners try to find out how much ice cream to buy for a sports event. Scholars use a pie chart showing the percent of a sample of people who like different flavors of ice cream. Using the...
Curated OER
Digital Statistics
Research data analysis by creating charts in class. Define the differences between an "average" and "range" while examining measurement data based on student height. Utilize computer software to create a height graph which is shared with...
Curated OER
Interest: Interest Olympics
Students determine how interests is calculated and a how it accrues. They examine charts and graphs that show the intricacies of interest. They determine how to increase their own saving by using interest while working with a partner to...
Other popular searches
- Pie Charts and Graphs
- Reading Charts and Graphs
- Behavior Charts and Graphs
- Charts and Graphs Candy
- Interpret Charts and Graphs
- Charts and Graphs Christmas
- Charts and Graphs Math
- Analyzing Charts and Graphs
- Tables, Charts and Graphs
- Charts and Graphs Europe
- Using Charts and Graphs
- Bar Graphs and Charts


