Math Moves U
Collecting and Working with Data
Add to your collection of math resources with this extensive series of data analysis worksheets. Whether your teaching how to use frequency tables and tally charts to collect and organize data, or introducing young mathematicians to pie...
Curated OER
Coordinate Plane and Number Line
In this graph and number line worksheet, students answer multiple choice questions about points on a graph and points on a number line. Students answer 10 questions.
Curated OER
The Power of Graphical Display: How to Use Graphs to Justify a Position, Prove a Point, or Mislead the Viewer
Analyze different types of graphs with learners. They conduct a survey and determine the mean, median and mode. They then identify different techniques for collecting data.
Curated OER
Interpreting Graphs
Students investigate graphs. In this graphing lesson plan, students create a graph regarding the population of California. Students extrapolate answers concerning the data set.
Mathematics Assessment Project
Temperatures
As a middle school assessment task, learners first examine line graphs of monthly temperatures for two locations, and then match box plots to each line plot.
Education Development Center
Points, Slopes, and Lines
Before graphing and finding distances, learners investigate the coordinate plane and look at patterns related to plotted points. Points are plotted and the goal is to look at the horizontal and vertical distances between coordinates and...
EngageNY
Rational Numbers on the Number Line
Individuals learn how to plot rational numbers on the number line in the sixth lesson of a 21-part module. They identify appropriate units and determine opposites of rational numbers.
Curated OER
Which Graph is best?
Pupils use commercial software to organize and visually display data to draw conclusions; students use graphing software to create several types of graphs illustrating the number of each color of M&M's in one bag.
Curated OER
Graphing Difference
Students use problem solving skills to reason, predict and problem solve through exploration. They recognize a way in which they are different from their peers and create a graph that shows these differences.
Houghton Mifflin Harcourt
Four-Quadrant Grid
Give your graphers a complete grid to neatly organize their coordinates and lines without having to draw one on their own. This four-quadrant grid provides labeled markers for each line up to -10 and +10 in all directions.
CK-12 Foundation
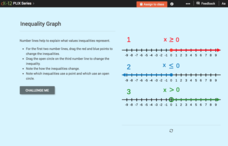
Inequality Expressions: Inequality Graph
Don't let inequalities be a drag. As young mathematicians drag the endpoint of the graph of an inequality in an interactive, the algebraic form of the inequality changes. This helps them see how the graph connects to the inequality.
CK-12 Foundation
Graphs in the Coordinate Plane: Functions on a Cartesian Plane
Connect the dots to graph a linear function. Young mathematicians use an interactive to first plot provided points on a coordinate plane. They connect these points with a line and then answer questions about the slope and y-intercept of...
Curated OER
Walking the Plank
This is a cool math activity. Kids collect and interpret data based on a physical act. A board is balanced between a scale and a step, learners record a peer's weight as it decreases while s/he walks further away from the scale. They...
Curated OER
Dealing With Data
Students collect, organize, and display data using a bar graph, line graph, pie graph, or picture graph. They write a summary describing the data represented and compare the graph to another graph in the class.
Curated OER
Statistics for Graphing
Students use the Internet to access a variety of websites that present statistics and information for use in graphing. They represent sports statistics, geographical measurements, temperatures and more.
Curated OER
Choosing the Best Graph
In this mathematics worksheet, 6th graders use a line graph to illustrate how a measure of data changes and explain their reasoning. Then they use a bar graph to compare pieces of data and a pictograph to compare data.
Virginia Department of Education
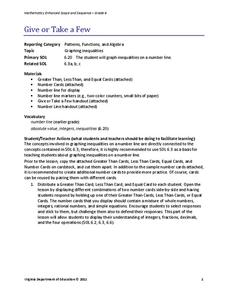
Give or Take a Few
Young mathematicians extend their knowledge of rational numbers on a number line to graph inequalities by first using number cards to compare rational numbers. They finish by using similar reasoning to graph inequalities on a number line.
Education Development Center
Geography of the Coordinate Plane
Put the graph into graphing and allow learners to understand the concept of point plotting and how it relates to data. The worksheet provides a nice way to connect data analysis to a graph and make predictions. The worksheets within the...
Math Drills
Halloween Cartesian Art
Jack-o-lanterns are the face of Halloween. Middle school mathematicians graph coordinates on a cartesian plane and connect the points to create a jack-o-lantern.
Shodor Education Foundation
Data Flyer
Fit functions to data by using an interactive app. Individuals plot a scatter plot and then fit lines of best fit and regression curves to the data. The use of an app gives learners the opportunity to try out different functions to see...
Math Worksheets Land
Halloween Cartesian Art: Bat
Get the class batty over graphing. Young mathematicians plot ordered pairs in all quadrants of a Cartesian plane, and connect the points to create a bat.
Math Drills
Thanksgiving Cartesian Art: Turkey
What does a turkey like to eat on Thanksgiving? Nothing, it's already stuffed. Turkey enthusiasts graph points on a Cartesian coordinate system
Math Drills
Thanksgiving Cartesian Art: Pumpkin
Not a Halloween jack-o-lantern, but a Thanksgiving pumpkin! Young mathematicians graph and connect points on a coordinate system to unveil the mystery picture.
Math Drills
Thanksgiving Cartesian Art: Pilgrim Hat
What did some Pilgrims wear on top of their heads? Individuals graph sets of ordered pairs, and connect the points to create a mystery Thanksgiving picture.
Other popular searches
- Double Line Graphs
- Graphs. Line Graphs
- Bar and Line Graphs
- Interpreting Line Graphs
- Making Line Graphs
- Reading Line Graphs
- Analyzing Line Graphs
- Creating Line Graphs
- Number Line Graphs
- Reading Double Line Graphs
- Straight Line Graphs
- Bar Graphs Line Graphs


