Scholastic
Study Jams! Histograms
With so many ways to organize data, a histogram is useful when we need to graph a variety of ranges. The interactive lesson plan organizes heights into different categories, not too big and not too small, to display on a histogram. The...
Buffalo-Hanover Montrose Schools
Histogram Worksheet
Young mathematicians analyze a given set of numbers to complete a frequency table, and then make a histogram using the data. The worksheet includes three sets of data on the worksheet.
EngageNY
Creating a Histogram
Display data over a larger interval. The fourth segment in a 22-part unit introduces histograms and plotting data within intervals to the class. Pupils create frequency tables with predefined intervals to build histograms. They describe...
EngageNY
Describing a Distribution Displayed in a Histogram
The shape of the histogram is also relative. Learners calculate relative frequencies from frequency tables and create relative frequency histograms. The scholars compare the histograms made from frequencies to those made from relative...
CK-12 Foundation
Understand and Create Histograms: Histograms
Tally ho! Represent the frequency of ages at school. Pupils finish a tally chart to match the frequencies of ages at school. Using the frequencies, the learners create a histogram. With the aid of the histogram and the frequency table,...
CK-12 Foundation
Understand and Create Histograms: Histograms
Determine the shape of weight. Using the interactive, class members build a histogram displaying weight ranges collected in a P.E. class. Scholars describe the shape of the histogram and determine which measure of central tendency to use...
CK-12 Foundation
Understand and Create Histograms: Car Sales
Create a history of car sales. Pupils create a histogram/bar graph to show the number of car sales made during the week. Using the data display, learners calculate numerical summaries of the data and find the percent of cars sold during...
Curated OER
Math Regents Exam Questions - Pearson Integrated Algebra P.304: Histograms
In this histograms worksheet, students solve 9 short answer, multiple choice, and graphing problems. Students construct frequency tables and histograms of data.
Mathed Up!
Histograms
Class members explore how to read and use histograms by watching a video on creating and analyzing histograms. To finish, the class works on a set of questions that tests these skills.
Curated OER
Graph It!
There is more than one way to represent data! Learners explore ways to represent data. They examine stacked graphs, histograms, and line plots. They conduct surveys and use stacked graphs, histograms, or line plots to chart the data they...
Shmoop
Box, Stem-Leaf, and Histogram
A helpful and versatile activity requires young mathematicians to analyze data in order to create graphs and answer questions. Additionally, it prompts learners to find the mean, median, mode, and range of some of the data sets.
Corbett Maths
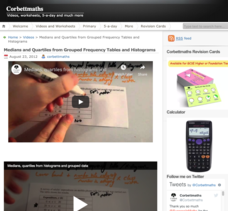
Medians and Quartiles from Grouped Frequency Tables and Histograms
Determine medians within a group. Given data represented as a frequency table of grouped data, the video demonstrates finding an estimation for the median. After finding the group where the median resides, the presenter uses a formula to...
Curated OER
Starting With Stats
Statisticians analyze a data set of student IQs by finding measures of central tendency and dispersion such as mean, median, mode, and quartiles. They practice using a graphing calculator to find the values and analyze box plots and...
Curated OER
Data Collection and Presentation
Middle and high schoolers collect and analyze data from four different activities. The activities include information about classmates, tallying colors of cars in a parking lot, stem and leaf plots, and making a histogram from winning...
Curated OER
Misleading Histograms
In this recognizing and interpreting a histogram worksheet, learners read and record the data and answer word problems using that data. Students solve 14 problems.
Curated OER
Histograms
In this histograms activity, students solve 5 word problems based on a histogram of presidential ages at their inauguration. Next, students create a frequency table and a histogram based on a list of data which shows the average snowfall...
Curated OER
Leveled Problem Solving: Histograms
In this using data, frequency table, and histogram to solve word problems worksheet, students solve problems about prices of toys and numbers of toys sold to solve consumer mathematics problems. Students solve six problems.
EngageNY
Describing Center, Variability, and Shape of a Data Distribution from a Graphical Representation
What is the typical length of a yellow perch? Pupils analyze a histogram of lengths for a sample of yellow perch from the Great Lakes. They determine which measures of center and variability are best to use based upon the shape of the...
Shodor Education Foundation
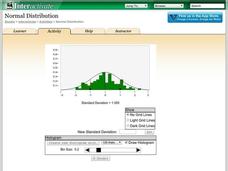
Normal Distribution
Does the size of the bin matter? The resource allows pupils to explore the relationship between the normal curve and histograms. Learners view histograms compared to a normal curve with a set standard deviation. Using the interactive,...
CCSS Math Activities
Baseball Players
Statistics is an important part of baseball. Given the mean weight of players on a baseball team, scholars determine the total weight of the players. They then find the median and range of weights for the opposing team. Lastly, they...
Curated OER
Histograms and Bar Graphs
Students are introduced to histograms, bar graphs, and the concept of class interval. They use an activity and three discussions with supplemental exercises to help students explore how data can be graphically represented (and...
Curated OER
Histograms: Practice
For this histograms worksheet, students use the bar graph histogram to answer questions 1-4 and the tally chart for question 5. Students finish with two test prep questions.
Curated OER
Histograms: Homework
In this histograms activity, students learn how to make a histogram. Students give graphs a title, draw the axes, label the vertical axis, choose an appropriate scale, and mark equal intervals. Students label the horizontal axis with the...
Curated OER
Boomerang
Students explore the concept of boomerangs. In this boomerang instructional activity, students throw homemade boomerangs at different angles to record maximum distance and if it returned or not. Students collect their boomerang data then...
Other popular searches
- Bar Graphs and Histograms
- Bar Graphs Histograms
- Interpreting Histograms
- Creating Histograms
- Making Histograms
- Frequency Histograms
- Frequency and Histograms
- Math Lessons Histograms
- Histograms and Bar Charts
- Math Statistics Histograms
- Histograms Median
- Hypothesis and Histograms


