Curated OER
Line graphs
In this line graphs worksheet, students read 2 line graphs and answer short answer questions about them. Students answer 5 questions for each graph.
Curated OER
Introduction to Graphs: Bar Graphs, Line Graphs, Circle Graphs
In this graphing data worksheet, middle schoolers answer 5 short answer questions about graphs. Students determine which type of graph best represents various data sets.
Curated OER
The Hudson's Ups and Downs
Even rivers have tides. Older elementary schoolers will discuss the Hudson River and how weather, water craft, and the ocean cause tidal fluctuation. They will examine a series of line graphs that depict tidal fluctuation, then analyze...
Curated OER
Graphing Difference
Students use problem solving skills to reason, predict and problem solve through exploration. They recognize a way in which they are different from their peers and create a graph that shows these differences.
Curated OER
Chart Your Course
Students explore change represented in graphs comparing distance and time. They exchange and share their graphs. Students interpret and create distance versus time line-graphs, and write stories based on these graphs. They interpret a...
Curated OER
Presentation of Quantitative Data- Vertical Line Diagrams
In this quantitative data worksheet, students examine how vertical line diagrams can be used to display discrete quantitative data. They read about the use of tally charts to create vertical line graphs that display the data. They...
Curated OER
Flicking Football Fun
Young mathematicians fold and flick their way to a deeper understanding of statistics with a fun, hands-on math unit. Over the course of four lessons, students use paper footballs to generate data as they learn how to create line...
Houghton Mifflin Harcourt
Four-Quadrant Grid
Give your graphers a complete grid to neatly organize their coordinates and lines without having to draw one on their own. This four-quadrant grid provides labeled markers for each line up to -10 and +10 in all directions.
CK-12 Foundation
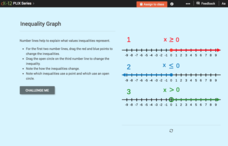
Inequality Expressions: Inequality Graph
Don't let inequalities be a drag. As young mathematicians drag the endpoint of the graph of an inequality in an interactive, the algebraic form of the inequality changes. This helps them see how the graph connects to the inequality.
CK-12 Foundation
Graphs in the Coordinate Plane: Functions on a Cartesian Plane
Connect the dots to graph a linear function. Young mathematicians use an interactive to first plot provided points on a coordinate plane. They connect these points with a line and then answer questions about the slope and y-intercept of...
Curated OER
Graph it!
Sixth graders view a Stacked Graph, and discuss what it shows. Students discuss the basics of graphing: labels, intervals, legends x and y axis... Students create individual stacked graphs from provided information. Students view a...
Curated OER
Usage and Interpretation of Graphs
Students explore graphing. In this graphing lesson, students predict how many shoe eyelets are present in the classroom. Students count eyelets and work in groups to organize and chart the data collected. Students put all the data...
Curated OER
Linking Number Patterns and Algebraic Expressions
Examine algebra using digital resources! Budding mathematicians will watch Cyberchase episode segments that propose a problem. Using information gathered from the video, they practice recording number patterns in several different ways:...
Curated OER
Graph Frenzy!!
Students brainstorm for a survey question to ask classmates. They survey their classmates. They enter the results into a spreadsheet and create the best graph for the information. They share their graphs with the class.
Curated OER
Statistics for Graphing
Learners use the Internet to access a variety of websites that present statistics and information for use in graphing. They represent sports statistics, geographical measurements, temperatures and more.
Virginia Department of Education
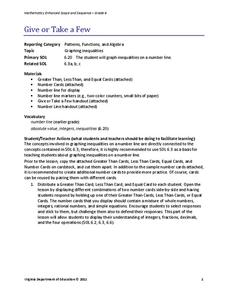
Give or Take a Few
Young mathematicians extend their knowledge of rational numbers on a number line to graph inequalities by first using number cards to compare rational numbers. They finish by using similar reasoning to graph inequalities on a number line.
Math Drills
Halloween Cartesian Art
Jack-o-lanterns are the face of Halloween. Middle school mathematicians graph coordinates on a cartesian plane and connect the points to create a jack-o-lantern.
Shodor Education Foundation
Data Flyer
Fit functions to data by using an interactive app. Individuals plot a scatter plot and then fit lines of best fit and regression curves to the data. The use of an app gives learners the opportunity to try out different functions to see...
Math Worksheets Land
Halloween Cartesian Art: Bat
Get the class batty over graphing. Young mathematicians plot ordered pairs in all quadrants of a Cartesian plane, and connect the points to create a bat.
Math Drills
Thanksgiving Cartesian Art: Turkey
What does a turkey like to eat on Thanksgiving? Nothing, it's already stuffed. Turkey enthusiasts graph points on a Cartesian coordinate system
Math Drills
Thanksgiving Cartesian Art: Pumpkin
Not a Halloween jack-o-lantern, but a Thanksgiving pumpkin! Young mathematicians graph and connect points on a coordinate system to unveil the mystery picture.
Math Drills
Thanksgiving Cartesian Art: Pilgrim Hat
What did some Pilgrims wear on top of their heads? Individuals graph sets of ordered pairs, and connect the points to create a mystery Thanksgiving picture.
Curated OER
Introduction to Representing and Analyzing Data
Represent data graphically. Allow your class to explore different methods of representing data. They create foldables, sing songs, and play a dice game to reinforce the measures of central tendency.
Florida Center for Instructional Technology
A Human Number Line: Teacher Notes
Twenty-one pieces of tagboard can lead your class to a greater understanding of integers when you use them to form a human number line. After creating this math tool, two strategies for adding and subtracting will have your...
Other popular searches
- Line Graphs
- Double Line Graphs
- Bar and Line Graphs
- Line Pie Bar Graph
- Interpreting Line Graphs
- Line Plot Graphs
- Making Line Graphs
- Reading Line Graphs
- Analyzing Line Graphs
- Creating Line Graphs
- Number Line Graphs
- Reading Double Line Graphs


