Corbett Maths
Simplifying Fractions
Put fractions in simpler terms. Learners watch a video showing how to simplifying fractions. They then work through two worksheets to practice the skill.
Corbett Maths
Improper Fractions to Mixed Numbers
What's the proper way to convert fractions? A short video shows three quick examples of converting an improper fraction to a mixed number. Pupils practice doing their own conversions to better understand the skill.
Corbett Maths
Multiplying Fractions
Multiply straight across. A video shows straightforward examples of multiplying fractions by multiplying the numerators and the denominators. Pupils practice the skill and give their answers as simplified fractions.
New Mexico State University
Agrinautica
Individuals play a computer game to terraform planets. Learners add plants, animals, fungi, and minerals to the planet surface by creating numerical expressions that represent the objects. After playing the game for a while, the class...
US Department of Commerce
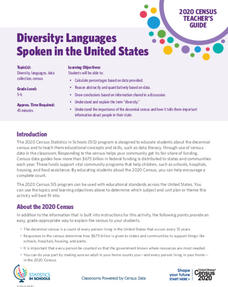
Diversity: Languages Spoken in the United States
High schoolers begin a discussion on diversity and determine the percent of the population that speak another language at home in the US. Classmates make a prediction of the percentage of people that speak another language at home in...
New Mexico State University
Creature Caverns
Plot the relationship of characteristics of creepy creatures. Learners plot the coordinates to describe the number of eyes, horns, and/or brains different creatures have. Pupils fill out a table to plot the points and complete the pattern.
New Mexico State University
Curse Reverse
Build towers with algebraic expressions. Pupils use algebraic expressions to build towers that allow their players to navigate a series of rooms. Learners evaluate expressions using different values for the variables to create a pathway...
New Mexico State University
Gate
Build numbers with place value to save the day. Pupils use the keyboard to control the digits in the hundredths through hundreds place to create target numbers to destroy shadows. As participants build the numbers, a number line shows...
New Mexico State University
Ratio Rumble
Develop a potion of ratios. Learners play a matching game to make potions that follow a recipe. Pupils create equivalent ratios to make multiple recipes at a given time. As levels increase, ratios get more difficult, as they include...
US Department of Commerce
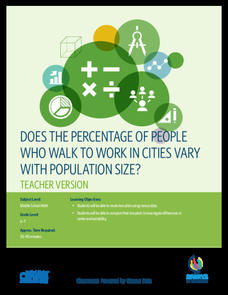
Does the Percentage of People Who Walk to Work in Cities Vary with Population Size?
To walk or not to walk? Pupils create box plots comparing the percentage of residents who walk to work in large, medium, and small cities. Using the box plots, class members compare the data that reflects available statistics. Scholars...
US Department of Commerce
Commuting to Work: Box Plots, Central Tendency, Outliers
Biking may be an outlier. Using data from 10 states on the number of people reporting they bike to work, pupils calculate the measures of center. Scholars determine the range and interquartile range and find which provides a better...
US Department of Commerce
Census in Counties - Describing and Comparing Histograms to Understand American Life
Use graphs to interpret life in 136 counties. Pupils analyze histograms and describe the shapes of the distributions of data collected from several counties on different aspects of life. Scholars make predictions on the difference in...
US Department of Commerce
Applying Correlation Coefficients - Educational Attainment and Unemployment
Correlate education with unemployment rates. Individuals compare state and regional unemployment rates with education levels by calculating the correlation coefficient and analyzing scatter plots. Pupils begin by looking at regional data...
US Department of Commerce
Make Data Speak
Data displays are more than just a bunch of numbers. Small groups access census results and create eye-catching data displays. Teams choose a statistic and collect data points for five locations. Classmates present their infographics to...
Radford University
Exploring Types of Variation Activity
Create a variable list of problems. Groups come up with four scenarios. Each situation represents different types of variation, direct, inverse, joint, and combined. Teams then generate questions about their contextual problems for...
Radford University
Statistical Study
Put your knowledge of sample surveys to good use. Pupils begin by conducting a survey of class members. They identify an appropriate topic and sampling technique; collect and organize their data; compute and analyze statistical measures;...
Radford University
PHamily PHeud: An Exploration in Surveys
Get to know the class much better. Scholars brainstorm a topic of interest and then design and conduct a class survey. Using the top responses, they create a game similar to Family Feud and take part in a class competition.
Radford University
Analyzing Data from Peer Survey
We all want to know what we're thinking. Scholars analyze and report data collected in a previous survey on peer attitudes toward current events. They calculate the mean, median, range, and standard deviation before creating histograms...
Radford University
Peer Survey on Current Events
Stay up to date on current events as well as how the class views the issues. A performance task has scholars select a current event of interest and design a class survey on the topic. They conduct the survey, analyze, and report the...
Radford University
The Next Big Thing
Make sure the next product is a hit. An engaging task has scholars design an item to sell at a sports event and then conduct a marketing survey. They decide whether to use random sampling, stratified sampling, or cluster sampling, and...
Radford University
Survey Activity
It's time to take a survey. After looking at an example of a survey on lunch preferences, groups design their own surveys. They consider the sample size and sampling technique, then conduct the surveys. As a final activity, they create...
Radford University
Data Analysis Activity
What do classmates think? In groups, learners design surveys to investigate chosen topics. They conduct the survey, then analyze the results. As part of the activity, they must calculate the mean, median, mode, variance, and standard...
Radford University
Connecting Theoretical and Experimental Probability
Play some games, develop a law, and then call it a day. Learners first perform a small number of trials for a probability experiment, then predict the result for a larger number of trials. They then compile data from the entire class to...
Radford University
AFDA Probability and Law of Large Numbers
The more trials scholars perform, the closer they'll likely be to the true value. After designing a probability experiment, young mathematicians conduct the experiment for five different numbers of trials. They then analyze the results,...


