Curated OER
Computer Tracks Lunch Choices
Students read a story called Computer Program Tracks Lunch Choices and answer vocabulary and comprehension questions about it. In this current events literacy lesson plan, students respond to literature by answering questions, recalling...
Curated OER
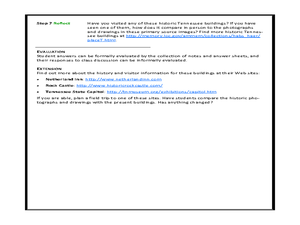
Finding the Area & Volume of Buildings Using Architectural Drawings
Fifth graders find the area and volume of buildings. In this architecture lesson, 5th graders look at the drawings of three historic Tennessee buildings. They use these to help find the area and volume of the building.
Curated OER
Measuring Marvels
Students investigate measurement. In this library lesson plan, students discuss measurement, read Millions to Measure by David Schwartz, and complete a worksheet. Extra related activities are included in the lesson plan that appeals to...
Curated OER
Past and Present: Using baseball statistics to teach math
Students use baseball cards to add up batting average and reinforce math skills. In this batting averages lesson plan, students use old baseball cards to practice different math skills and look at other baseball statistics.
Curated OER
Closer To the Ground Lesson 2: Providing a Helping Hand
Students examine how businesses and corporations contribute or sponsor activities for the common good. They read annual reports of major corporations to determine how they contribute to focused activities for the common good.
CK-12 Foundation
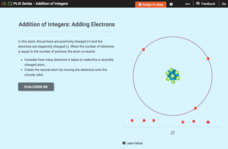
Addition of Integers: Adding Electrons
Young mathematical scientists interact with protons and electrons in an atom to create a neutrally charged atom. They answer questions based on their findings throughout the interactive resource.
CK-12 Foundation
Input-Output Tables for Function Rules
How does changing a graph affect the function? Learners watch the changing input-output table as they adjust the location of the line graph. Questions prompt them to complete a table of values and determine the function rule.
CK-12 Foundation
Fraction Ordering with Lowest Common Denominators: Test Your Strength
Young mathematicians use a bell and hammer to see how high or low the puck goes. Then, they order the fractional values to demonstrate the greatest to lowest hit. Students then respond to several questions that require them to use...
CK-12 Foundation
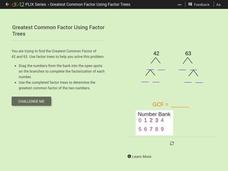
Greatest Common Factor Using Factor Trees
Beginning with a description that sets the stage, learners are asked to break down the numbers 42 and 63 to find the greatest common denominator using factor trees. As they work through the factoring process, young mathematicians are...
CK-12 Foundation
Sets: Bikes or Boards?
Do people ride, slide, or do both? Pupils use an interactive Venn diagram for the numbers of people owning bicycles, owning skateboards, or both. An interactive provides questions for them to answer using the diagram.
CK-12 Foundation
Venn Diagrams: Planets and Dwarf Planets of the Solar System
Yes, Venn diagrams are helpful in science, too. Learners use an interactive to classify celestial bodies as having moons, as dwarf plants, as both, or as neither. They answer a set of challenge questions based on the Venn diagrams they...
CK-12 Foundation
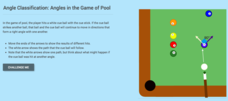
Angle Classification: Angles in the Game of Pool
Make a game of angle classification. Using the direction of the pool ball, scholars determine the measure of the created angles. They work to create and classify different types of angles throughout an engaging interactive.
CK-12 Foundation
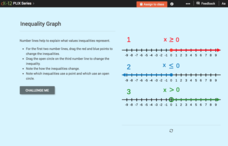
Inequality Expressions: Inequality Graph
Don't let inequalities be a drag. As young mathematicians drag the endpoint of the graph of an inequality in an interactive, the algebraic form of the inequality changes. This helps them see how the graph connects to the inequality.
CK-12 Foundation
Rational Numbers in Applications: Pizza with Friends
Explore the application of fractions in a real-life situation. Learners manipulate an interactive simulation to model a given scenario. They find fractions of fractions and explain the importance of the part-to-whole comparison.
CK-12 Foundation
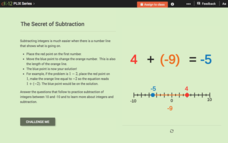
Properties of Real Number Addition: The Secret of Subtraction
Learners sometimes struggle to understand the concept of adding and subtracting integers. Help them see the why behind their answers using the interactive number line. The values change as individuals adjust the number line for each new...
CK-12 Foundation
Function Rules for Input-Output Tables: Soda Sugar Function Table
Examine the relationship between the input and output variables in a table of values. As learners build an input-output table using online manipulatives, they begin to identify patterns. They answer questions about these patterns and...
CK-12 Foundation
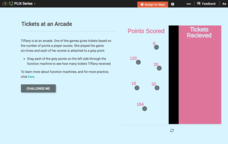
Function Rules for Input-Output Tables: Tickets at an Arcade
This is the ticket to learning about function rules! Using online manipulatives, scholars build a table of values and then answer questions about the related function. They examine the relationship between the input and output values and...
CK-12 Foundation
The Real Numbers: Adding Electrons
Get a charge out of a great resource! Scholars use an interactive to explore addition and subtraction of integers. They add or remove electrons in an atom model to consider its charge.
CK-12 Foundation
Line Graphs to Display Data Over Time: Strawberry Competition
Take the tediousness out of graphing. Using the interactive tool, learners can efficiently create a line graph from a set of data. They then use the graph to answer questions about specific trends in the data.
CK-12 Foundation
Two-Sided Stem-and-Lead Plots: Gamers
Which gender spends more time playing video games? Your classes use provided data to answer this question. They first build a two-sided stem-and-leaf plot and then use the display to look for patterns. Guiding questions help them...
Curated OER
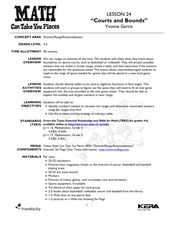
Courts and Bounds
Students relate what they know about boundaries on sports courts to explore range of space. In this domain and range lesson, students identify numbers needed to calculate ranges and use the problem solving strategy of making a table.
Curated OER
A Measuring Adventure
Young scholars practice measuring items. In this measurement lesson plan, students read the book Measuring Penny and create their own system of measurement. Young scholars measure various items in the classroom, using their creative...
Curated OER
Making a Difference in World Health
Students discover environmental awareness by conducting a collection project in class. In this global food lesson, students identify the importance of feeding all of the humans on Earth and discuss why some aren't properly nourished....
Curated OER
Bake, Boil, or Fry
Students write a journal entry about where there food comes from. In this Civil War lesson, students discuss journals, the crops grown within the U.S., the import/export process and what food preparation must have been like on a...


