Curated OER
Famous People: Teacher Notes
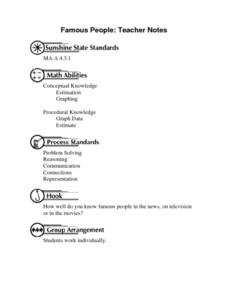
Young statisticians practice creating scatter plots. First, they estimate the age of 14 people. Next, they write down the estimate in a table labeled x. Then write down their actual age in the table labeled y. Using these x and y...
Curated OER
Students Analyze Data With Scatter Plots
Scatter plot lessons can help students create different types of graphs by hand or with the aid of technology.
Curated OER
Flicking Football Fun
Young mathematicians fold and flick their way to a deeper understanding of statistics with a fun, hands-on math unit. Over the course of four lessons, students use paper footballs to generate data as they learn how to create line...
Curated OER
Button Bonanza
Collections of data represented in stem and leaf plots are organized by young statisticians as they embark some math engaging activities.
Curated OER
Word Problems: "Leaving D.C."
In this solving math story problems learning exercise, students read statistics from the Student edition of USA Today to solve word problems. Students solve 6 problems.
Curated OER
Geometry and Measurement
Young geometers explore relationships between units of measure and objects. Three activities provide varied opportunities to practice. Learners calculate the volume of two cylinders made by rolling a piece of paper vertically and...
Curated OER
Scatter Graphs
In this scatter graphs worksheet, students learn a way of illustrating information about two related values. Students complete 30 questions about the graphs. Note: One of the graphs has English pounds. This is intended as an online...
American Statistical Association
Speedster
Catch me if you can. Scholars collect data on reaction time by catching a falling ruler or by using an Internet app. They determine the median of the data, create graphs, and analyze the results. They also compare their data to the rest...
Curated OER
Getting A Grip On Graphs
Fourth graders investigate the concept of graphing and comparing different types of data using pictographs, line graphs, scatter plots, etc... They gather data and make interpretations while examining the medium of how it is displayed.
Curated OER
In the Wake of Columbus
Young scholars explore how the population decreased in native cultures.
Curated OER
The Bigger they Are . . .
Young scholars do a variety of data analyses of real-life basketball statistics from the NBA. They chart and graph rebounding, scoring, shot blocking and steals data which are gathered from the newspaper sports section.
Curated OER
Graph Made Easy-Pre Test Questions
In this graphing pre test worksheet, students complete a set of 10 multiple choice questions. Page is labeled as a pretest, an answer link is provided.
Other popular searches
- Scatterplots
- Scatterplots and Correlation
- Interpreting Scatterplots
- Create Scatterplots
- Algebra 2 Scatterplots
- Drawing Scatterplots
- Explaining Scatterplots
- Scatterplots Heart
- Pre Algebra Scatterplots
- "Algebra 2" Scatterplots
- Algebra 2" Scatterplots


