Curated OER
Math: Navigating the World Around Me
Young mathematicians research and discuss real world math word problems and ways in which they apply math concepts in their everyday lives. They create a storyboard of a math word problem from which they create a slide for a multi-media...
Curated OER
Sunshine Math 3
In this word problems instructional activity, learners read and problem solve nine mathematical word problems involving grids, measurement, compensation and angles.
Curated OER
Double Bar Graphs - Homework 7.1
Your learners have seen basic bar graphs, but do they have experience reading double bar graphs? This learning exercise details how to draw a double bar graph and provides an example with six accompanying questions. The final question...
Curated OER
Drive the Data Derby
Three days of race car design and driving through the classroom while guessing probability could be a third graders dream. Learn to record car speed, distances traveled, and statistics by using calculation ranges using the mean, median,...
Curated OER
Jelly Bean Math Activities
Using jelly beans as math manipulatives can be a tasty way to introduce and reinforce math concepts. Regardless of the time of year, candy can be used to excite learners and facilitate a wide variety of mathematical concepts.
Teacher's Corner
Brandon's Baseball Collection
Ten questions make up a worksheet that challenges baseball enthusiasts to read a graph then answer questions pertaining to the data's range, mean, median, and mode.
Curated OER
Create a Graph Online
Scholars create colorful bar, line, or pie graphs. They decide on a survey question to ask or a type of data to gather. From there, they collect information and data. They display this data in bar, line, or pie graphs that they create...
Curated OER
Graphs to Represent a Data Set
By analyzing a word problem about hours worked in a week, scholars get valuable practice with bar graphs and data analysis. They read the scenario, then examine a table of data taken from it. The data includes four days and the...
California Academy of Science
California's Climate
The United States is a large country with many different climates. Graph and analyze temperature and rainfall data for Sacramento and Washington DC as you teach your class about the characteristics of Mediterranean climates. Discuss the...
Curated OER
Graph Mole
Practice graphing ordered pairs by playing an online graphing game. Learners will discover why it is useful to plot coordinates on a xy plane. Graph Mole, is the online game that allows them to practice through a fun, interactive story....
Curated OER
Run, Gingerbread Men, Run!—Game
Run, gingerbread men! During the board game, four gingerbread men race to discover which one finishes first. Scholars take note of the game's results using a tally chart and bar graph for all to observe the frequency of the winning...
Curated OER
Double Bar Graphs (Reteach 15.1)
In this graphs worksheet, students analyze the data on two double bar graphs. Students answer 4 questions about the information on the graphs.
Curated OER
Reading Line Graphs
In this line graphs worksheet, 4th graders, after studying a line graph illustrating Emily's hiking record, answer 4 short answer questions relating to the line graph.
Curated OER
Reading Bar Graphs: My Favorite Subject
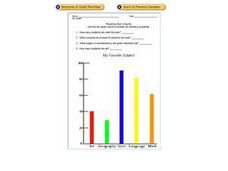
In this bar graphs worksheet, students analyze a bar graph about favorite school subjects. Students use the information on the graph to answer 7 questions.
Curated OER
All About Graphs
Students practice organizing data by creating graphs. For this statistics lesson, students survey the class about favorite colors and create a bar graph using the data. Students complete a test based on pet and animal statistics.
Curated OER
Fish Communities in the Hudson
Learning to read data tables is an important skill. Use this resource for your third, fourth, or fifth graders. Learners will will study tables of fish collection data to draw conclusions. The data is based on fish environments in the...
Curated OER
Transportation Math
Students explore the concept of exponents. In this exponents lesson, students evaluate various bases to powers. The bases to a given power are in the context of miles driven, stops on a route, and minutes spent in route. Students read...
Curated OER
Problem Solving: Use a Graph: Problem Solving
In this bar graph activity, students read the word problem and use the bar graph to complete the problem solving questions for understand, plan, solve, and look back.
Federal Reserve Bank
Less Than Zero
Perry the penguin wants to buy a new scooter, but he doesn't have any funds! Walk your kids through the short book Less Than Zero, and have them track his borrowing, spending, and saving on a line graph while you read. Pupils will learn...
Curated OER
Graphing with Stems-and -Leafs
Fourth graders examine the use of stem and leaf graphs. In this stem and leaf graph activity, 4th graders participate in teacher led activity showing the use of the graphs. They work in groups to collect data about peanuts before making...
Curated OER
Graphs - Online Activity
In this interpreting graphs worksheet, students complete an on-line activity in which they read both a line graph and a bar graph. They answer questions about how many of each letter is shown on a line graph and how many of each child's...
Curated OER
Applied Science - Science and Math Lab
Students make a prediction. In this applied science lesson plan, students guess the number of items in a jar. Students create a bar graph to show the predictions and the actual amounts.
Curated OER
Build A Skittles Graph
Students explore graphing. In this graphing lesson, students sort Skittles candies and use the color groups to create a bar graph. Rubrics and extension activities are provided.
Curated OER
Math Who Am I?
In this math vocabulary worksheet, students read each description of a math term and write the word on the blank line. They circle every third letter in each letter box next to the clue to check their answer. They complete 8 definitions.


