Curated OER
Take a Chance on Probability
Connect ratios, probability, and combination outcomes with a challenging activity idea. It guides your learners through probability of an event as fractions or ratios, on a number line, and with correct vocabulary. The class will be...
Curated OER
M & Ms in a Bag
Students make predictions about the number and colors of M&M's in a snack size package. They create an Excel spreadsheet to record the data from their small group's bag, create a graph of the data, and discuss the variations of data...
Curated OER
M&M’s Math Worksheet
Who knew you could cover prediction, histograms, fractions, decimals, data collection, and averages (mean, median, and mode) all with a bag of M&M's®? Here's a fantastic set of worksheets to help you make candy a mathematical journey...
Curated OER
An Introduction to Data Reading and Computations
Learners discover data reading and computations. In this math lesson plan, students collect nutritional data about intakes of certain foods compared with daily recommended allowances. Learners create their own data charts based on their...
Utah Education Network (UEN)
The Human Line Plot
Learners collect data and use charts and line plots to graph the data. Some excellent worksheets and activities are embedded in this fine lesson on line plots.
Computer Science Unplugged
Battleships—Searching Algorithms
How does a computer perform a search in order to find data? The lesson begins with a demonstration on finding one number out of 15. Pairs then play three games of Battleship by using different search techniques. The lesson plan finishes...
Curated OER
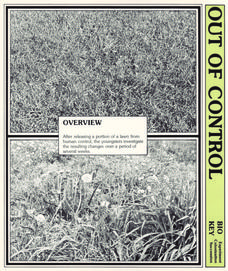
Out of Control
Students release care of a lawn. In this Science lesson, students observe the changes that occur when lawn maintenance is stopped. Students record data from several observations.
Curated OER
Making Paper
Students explore paper making. In this cross curriculum multicultural ecology and art lesson, students follow written and oral instructions to make paper using common household items. Students predict the amount of paper use in their...
Discovery Education
Mood Music!
Grouchy? Sad? Here's a great resource that shows kids how music can be used to lift their spirits. Kids collect and chart data on the effects of music on emotions. After analyzing the results of their experiment, they develop their own...
Curated OER
Robot Rounding!
Young scholars collect data on a robot and relate the behavior to prove there is an infinite minute set of numbers. In this algebra lesson plan, students verify that there is always a number between two numbers. They analyze and make...
Curated OER
Range, Mean, Median, Mode
Students research the impact of craters. In this range, mean, median and mode lesson plan, students complete an experiment with a marble to simulate the effects of a crater. Students collect and analyze data finding the range, mean,...
American Statistical Association
Spinners at the School Carnival (Unequal Sections)
Everyone's a winner. Scholars analyze a spinner with five unequal sections, three of which represent winning a toy car and the other two represent winning a toy truck. They conduct an experiment to estimate the number of toy cars and...
Curated OER
Measurement (Grades 3-5)
Third, fourth, and fifth graders participate in measurement centers. They visit six different centers: standard and linear measurement, clocks, weight, volume, temperature, and converting measurements. They complete a data collection...
Curated OER
"who Lives in Your House?"
Fourth graders collect data about the people and animals living in their homes, and the students' shoe sizes. They work in groups to enter the information into a database from which they create graphs. They analyze the data to find the...
Curated OER
Lyrics Statistics
Students describe, analyze and generalize relationships, patterns, functions using words. symbols, variables, tables and graphs.
Curated OER
Count on Math
Learners develop number sense up to a million. In this developing number sense up to a million lesson plan, students count their breaths in given time span. Learners use blocks representing 10's and 100's to create a million. Students...
Curated OER
Traffic Light Probability
Students discuss the possible traffic signals that may be observed on the way to a field trip. They record data on the trip, and analyze the probability of the results occurring again.
Curated OER
Go Fish!
Students collect data, interpret data summarize proportional reasoning. Students determine (with various alternate goods) the number of fish in a nearby pond. Students capture the goldfish crackers, deal with pretzels and then write...
Prince William Network
Migration Math Madness
A great way to incorporate math into life science, this lesson has learners measure migratory routes on a map and calculate the actual distance that shorebirds on the routes would cover. Learners compute the distance covered in both...
Curated OER
Graphs Abound
Young scholars create a survey for their classmates to collect data on their favorite foods, eye color, pets or other categorical data. They compile the data from the survey in a table and then make a bar graph of each category using a...
Curated OER
Confusing Colors!
Fourth graders collect data, graph their data, and then make predictions based upon their findings. They's interest is maintained by the interesting way the data is collected. The data collection experiment is from the psychology work of...
Curated OER
Polluting the Environment
Fourth graders construct mini-ecosystem, pollute the ecosystem, observe, collect, and record data on the effects of these pollutants on their ecosystem, organize data on spreadsheets, create graphs, and design presentations to share with...
Curated OER
Graphing Lesson Plans
By using hands-on graphing lesson plans students can learn how to collect data, and display the information using graphs.
Curated OER
Candy Colors: Figuring the Mean, Median, and Mode
Students count candy by color and then calculate mean, median, and mode. They count candy and use the data to calculate mean, median, and mode (by color) and apply their learning to another collection of data.


