Curated OER
Probability and Statistics
Elementary schoolers choose from a host of activities to investigate probability and statistics. They complete worksheets, create 3-D graphs, and play graph bingo. They make weather predictions and list all the possibilities before going...
Curated OER
Rubber Band Banza
Third graders review ideas about sound and vibration to make their own stringed instrument. They review what a pictograph and bar graph are. Pupils conduct a survey within the classroom to choose the four favorite string instruments and...
Curated OER
Call it "Macaroni"
Who knew there were so many fun educational opportunities featuring pasta? Scholars read a brief informational text about the history of pasta (note that "macaroni" is spelled two different ways, so address this if kids are reading...
Baylor College
Water: The Math Link
Make a splash with a math skills resource! Starring characters from the children's story Mystery of the Muddled Marsh, several worksheets create interdisciplinary connections between science, language arts, and math. They cover a wide...
Curated OER
Graphing
Students collect data to create different types of graphs-line, pie, and bar graphs. They use StarOffice 6.0 to create graphs.
Curated OER
Math--Pictures and Bars--Learning About Graphs
What is a graph? What does it tell us? How do you make one? These are all questions that are answered in the included packet. It's a great introduction to graphing for young learners!
Curated OER
Drive the Data Derby
Three days of race car design and driving through the classroom while guessing probability could be a third graders dream. Learn to record car speed, distances traveled, and statistics by using calculation ranges using the mean, median,...
Curated OER
Build A Skittles Graph
Young scholars explore graphing. In this graphing lesson plan, students sort Skittles candies and use the color groups to create a bar graph. Rubrics and extension activities are provided.
Curated OER
All About Graphs
Students practice organizing data by creating graphs. In this statistics instructional activity, students survey the class about favorite colors and create a bar graph using the data. Students complete a test based on pet and animal...
Curated OER
Graphing With Candy
Students gather information and interpret the results using a tally chart, a table, and a bar graph.
Curated OER
M&M Graphing and Probability
Learners sort, classify, and graph M & M's. They create pictographs and bar graphs with the colors and numbers in each bag of M & M's. They calculate the ratio and probability based on class results.
Curated OER
Bar Graphs
For this bar graph worksheet, students complete math problems having to do with different bar graphs. Students complete 10 problems for 10 different graphs.
Curated OER
Graphs to Represent a Data Set
Here are the number of animals Jackson saw at the zoo; scholars organize data into bar graphs using this instructional activity. Encourage labeling, but consider having scholars do these on another sheet because there isn't room for the...
Curated OER
Bar Graph
In this bar graph worksheet, students answer short answer questions about a bar graph of student's favorite sandwich fillings. Students complete 5 questions.
Curated OER
Use a Bar Graph
In this bar graph instructional activity, students use a given bar graph to answer a set of 3 questions. Answers included on page 2.A reference web site is given for additional activities.
Curated OER
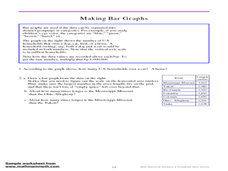
Making Bar Graphs
In this bar graph worksheet, students answer short answer questions about bar graphs. Students answer 1 question about a bar graph about a cat, and 3 questions about a bar graph about U.S. rivers.
Curated OER
Problem Solving Application: Using a Bar Graph
In this bar graph worksheet, students use a set of 2 bar graphs to answer 6 related questions. Answers are included on page 2. A reference web site is given for additional activities.
Curated OER
Bar Graph: Vacation Fun
In this bar graph worksheet, students use a bar graph showing pictures taken on a vacation to complete 6 related questions. Answers are included on page 2.
Curated OER
Making a Bar Graph
In this bar graph instructional activity, students analyze a data table and bar graph depicting information about stickers collected. Students answer 5 questions about the data displayed.
Curated OER
Create a Bar Graph
In this bar graph worksheet, learners use a set of clues about favorite types of books to draw the bars on a graph. Answers are included on page 2.
Curated OER
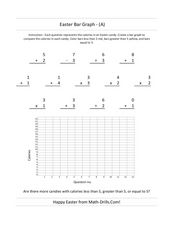
Easter Bar Graph- A
In this Easter math worksheet, students first solve 13 problems with addition, subtraction, multiplication and division. Using the answers, students make a bar graph.
Curated OER
Bar Graph Activity: Spelling Bee
In this bar graph worksheet, students use information about a class spelling bee, shown in a bar graph, to complete a set of 7 related questions. Answers included on page 2.
Curated OER
Graphing in the Form of Bar Graphs
Students explore bar graphs. In this math instructional activity, students create and conduct a survey. Students graph their data in a bar graph.
Curated OER
Horizontal Bar Graph-- Blank Grid
In this math worksheet, students use the blank horizontal bar graph to record and display any data and to learn the correct way to generate a bar graph. Spaces are marked for students to write in the title and labels; intervals of 1-10...
Other popular searches
- Skittles Bar Graph
- Double Bar Graphs
- Bar Graphs Pictographs
- Histogram and Bar Graph
- Bar Graphs and Histograms
- Bar Graph Problem Solving
- Favorite Food Bar Graph
- Bar Graphs Histograms
- Interpreting Bar Graphs
- Bar Graphs for Birthdays
- Bar Graph Worksheet
- Bar Graphs and Charts


