Curated OER
The Three M's of Statistics: Mode, Median, Mean
Young mathematicians use the Visual Thesaurus to define mean, median, and mode. In this mean, median and mode lesson, learners use online sources to find the definitions of mean, median, and mode before applying the concepts to a class...
Curated OER
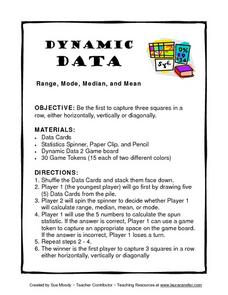
Dynamic Data Range, Mode, Median, and Mean
In this lesson, Dynamic Data Range, Mode, Median, and Mean, students play a game while figuring range, mode, median, and mean. Students spin for their task, figure the mode, mean, median or range of a row of numbers and gain a space on...
Mathematics Assessment Project
Mean, Median, Mode, and Range
What a find! Here is a instructional activity, designed to meet sixth grade math Common Core standards, that focuses on the calculation of different measures of center for the scores from a penalty shoot-out competition. An independent...
Curated OER
Introduction to Representing and Analyzing Data
Represent data graphically. Allow your class to explore different methods of representing data. They create foldables, sing songs, and play a dice game to reinforce the measures of central tendency.
Curated OER
Drive the Data Derby
Three days of race car design and driving through the classroom while guessing probability could be a third graders dream. Learn to record car speed, distances traveled, and statistics by using calculation ranges using the mean, median,...
Curated OER
Are You My Little Peanut?
Fourth graders explore the mass and length of peanuts by pretending to parent a peanut. In this mode, median and range lesson students graph their measurements and then use them to find the mode, median and range. Students discuss peanut...
Curated OER
What Can Data Tell Us?
Students explore data distribution. In this data analysis instructional activity, students create a data distribution table by playing the game "Tower of Hanoi" from the Hall of Science. Students analyze their data and answer data driven...
Curated OER
Range, Mode, and Median
Fifth and sixth graders sort data from least to greatest and mark an X on the line plot to show how many of each number. Then they determine the range, mode, and median for the problem.
Curated OER
Mean, Median, Mode, etc.
Explore the concept of mean, median, and mode with pupils. They estimate the length of a string or the number of M&M's in a jar. Then find the mean, median, and mode of the class' estimates.
Curated OER
Button Bonanza
Collections of data represented in stem and leaf plots are organized by young statisticians as they embark some math engaging activities.
Curated OER
Pick A Number
Elementary schoolers find out which month has the most class birthdays (mode) and which birthday represents the middle point of all the birthdays (median). They gather and organize data to find one number that fairly represents the whole...
Curated OER
Guess-timating Fun
Learners estimate the number of items in a jar and write their estimate boldly on a piece of paper. They line up holding their numbers. Then, they calculate the median, mean, mode and average of the guesses.
Curated OER
Mean, Median, Mode, and Range
Fifth graders determine the meaning of mean, median, mode, and range. In this measures of central tendency lesson, 5th graders show their ability to find the mean, median, range, and mode of a data set. They use a class set of birthday...
Curated OER
Range, Mean, Median, Mode
Students research the impact of craters. In this range, mean, median and mode lesson plan, students complete an experiment with a marble to simulate the effects of a crater. Students collect and analyze data finding the range, mean,...
Curated OER
Energy Audit
Students collect data about energy usage and use mathematical calculations to analyze their data. In this energy conservation and statistics math lesson, students survey their homes to complete an energy usage worksheet. Students...
Curated OER
Dealing with Data in Elementary School
Students follow the scientific method in collecting data. In this following the scientific method in collecting data instructional activity, students develop a question they would like answered such as how many aluminum cans are...
Curated OER
Mean, Median, Mode and Range
Fourth graders investigate when to find the mean, median, mode and range. In this statistical concepts lesson, 4th graders collect data, make observations and graph the data. Students verify their work on the computer.
Alabama Learning Exchange
The Mean, Median, and Mode Chain Gang
Students analyze a set of data. They work in cooperative groups and use chain links to identify the mean, median, and mode of the chain.
Curated OER
Mean, Median and Mode
Students explore websites and the included PowerPoint presentation to gain a better understanding of mean, median and mode. A weather worksheet is included for in-class work and assessment.
Curated OER
Madley Brath #39 - Stem and Leaf Plots, Mean, Median, Mode and Range
In this measures of central tendency worksheet, students draw a stem and leaf plot of a set of test scores. They compute the mean, median, mode, and range of the data set, and round the answers to the nearest tenth.
Curated OER
What Does Average Look Like?
Fifth graders explore the concepts of range, median, mode, and mean through the use of graphs drawn from models. They use manipulatives to represent data they have collected within their groups, and compare the differences between mode,...
Curated OER
Create Your Own Form
Students gather and organize data using a mock census form, and determine mean, mode, range, and median for sets of data.
Curated OER
Ice Cream
Students explore the concepts of mean, median, mode, and range as they elicit data about people's favorite flavor of ice cream. A practical application of the data obtained offers an extension to the lesson plan.
American Institutes for Research
Digital Smiles
Explore metric measurement, recording data, and creating an electronic spreadsheet displaying results with your math class. Scholars will measure the length of their smiles, record the measurements, and represent the results on an...


