Hi, what do you want to do?
PBS
Career Connections | Bookkeeping and Accounting
Keeping track of the finances is the job of the accountant and the bookkeeper. Find out what skills add up to make it in the world of ledgers and numbers.
Corbett Maths
Median for a Frequency Table
Try to find the middle of a frequency table. Using a frequency table of ages, the video shows how to use a formula to determine the position of the median. The resource uses frequency tables with both even and odd numbers of data points.
Corbett Maths
Medians and Quartiles from Grouped Frequency Tables and Histograms
Determine medians within a group. Given data represented as a frequency table of grouped data, the video demonstrates finding an estimation for the median. After finding the group where the median resides, the presenter uses a formula to...
Corbett Maths
The Median
Find the one in the middle. An informative resource explains how to determine the median of a set of numbers. Using both even and odd numbers of data points, the video covers the process of finding the middle number. Worksheets provide...
Corbett Maths
The Range
Spread the data out on the range. The short video provides a definition of the range. Using a data set of five numbers, the resource calculates the range.
Corbett Maths
The Mean
Two steps toward the mean. Using a set of five numbers, a video shows the calculation steps needed to find the mean. Classmates then practice the new skills independently.
Corbett Maths
Estimated Means from Grouped Data
Can scholars determine the mean if the frequency is for a range? By using a method similar to finding the mean from a frequency table, the video shows how to find an estimated mean for grouped data. It uses the midpoint of the interval...
Corbett Maths
Means from Frequency Tables
Shorten the calculations with the power of multiplication. Using the meaning of multiplication, the video shows a more efficient method of calculating the mean for data displayed in a frequency table. There is no need to write out each...
PBS
Real-Life Math | Data Analyst
Data is just waiting for scholars to analyze. By viewing a video of a data analyst explaining his job and the math that surrounds it, scholars begin a lesson on data collection and analysis. Groups develop questions for a poll on teenage...
Anywhere Math
Measures of Center
Bring statistics to the front and center. An informative video describes how to find measures of center for numerical data. It covers the mean, the median, and the mode, as well as briefly mentions outliers.
Anywhere Math
Measures of Variation
Variation makes the world—and data sets—more interesting. Young data analysts view an engaging YouTube video to learn about measures of variation. Range and interquartile range are the topics under consideration here.
Anywhere Math
Mean Absolute Deviation
I mean it when I say that you'll learn about mean absolute deviation. By watching an informative YouTube video, viewers see how to calculate the mean absolute deviation. The video shows a few examples and explains the interpretation of...
Brightstorm
Mean - Concept
You mean it's just average? Provide the definition of the mean of a set of data with a concept video. The instructor works three problems that use the concept of the mean. Each problem increases in difficulty from finding a basic average...
Scholastic
Study Jams! Mean/Average
Join Zoe as she calculates the average number of points RJ scored in his basketball games. This step-by-step presentation clearly models the procedure for finding the mean of a data set, including examples with both whole number and...
Scholastic
Study Jams! Median
Zoe is curious how many goals her soccer team usually scores in a game. To answer the question, she walks through the process of finding the median of a data set in this step-by-step presentation. Examples are included that model how to...
Scholastic
Study Jams! Mode
Sam is running for class treasurer and Zoe wants to know if he won the election. Follow along as she counts up the votes and uses the mode to determine the winner. After viewing the presentation, work through the Try It! practice...
Khan Academy
Khan Academy: Algebra: Average or Central Tendency:arithmetic Mean, Median, Mode
Video explains the different measures of center: arithmetic mean, median, and mode. Gives examples of finding each measure of central tendency and discusses the effect of outliers on each. Includes a link to additional practice problems....
Sophia Learning
Sophia: The Effects of Outliers on Centers of Measure
Explore the effects of outliers on mean, median, and mode.
Math Mammoth
Math Mammoth: Mean, Median, and Mode: Measures of Central Tendency
In this lesson, students learn about measures of central tendency and how the mean, median, and mode work in different contexts. [9:25]
Khan Academy
Khan Academy: Mean Absolute Deviation (Mad)
The video shows how to calculate the mean absolution deviation of a data set.
Khan Academy
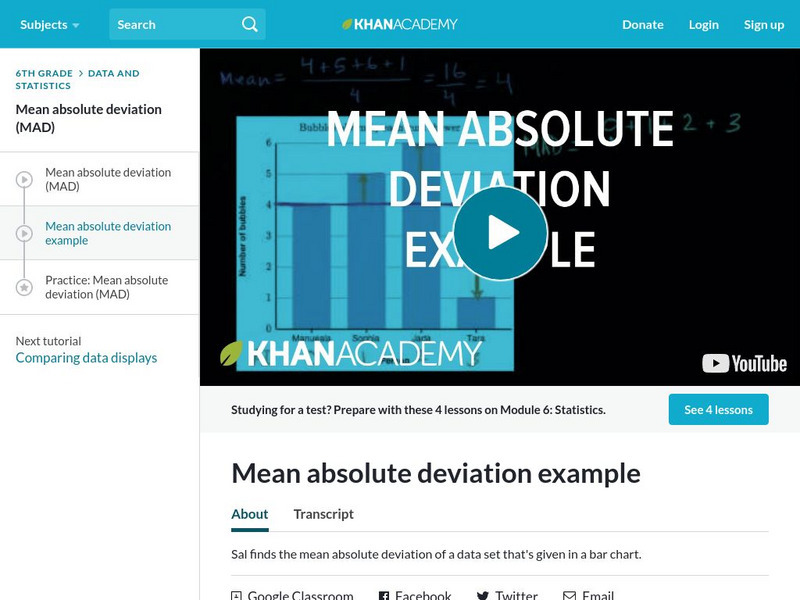
Khan Academy: Mean Absolute Deviation Example
The video is an example of finding the mean absolute deviation from a bar graph.
Khan Academy
Khan Academy: Mean, Median, & Mode Example
The video gives a data set and describes how to find the mean, median, and mode.
Khan Academy
Khan Academy: Statistics Intro: Mean, Median, & Mode
The video introduces statistics and explains the three different ways to describe the center of a data set.
Khan Academy
Khan Academy: Statistics: Average
Video briefly talks about types of statistics. Gives demonstration of how to find arithmetic mean, median and mode of a set of numbers. Discusses how well each measure represents the data set. Includes link to practice problems. [12:34]


