University of Colorado
Happy Landings: A Splash or a Splat?
Huygens spacecraft landed on Saturn's moon Titan in 2005, making it the farthest landing from Earth ever made by a spacecraft. In this hands-on activity, the 12th installment of 22, groups explore how density affects speed. To do this,...
It's About Time
Volcanic Hazards: Airborne Debris
Pupils interpret maps and graph data related to volcanic ash. Then they analyze the importance of wind speed and the dangers of the ash to both life, air temperature, and technology.
Florida Center for Reading Research
Fluency: Letter-Sound Correspondence, Letter Flash
Scholars work in pairs to drill and practice alphabet sounds, keeping track of their progress on a chart. Working one at a time, each partner flips letter cards, saying the sound and letter. If they get it correct, it goes in the YES...
Curated OER
Plotting Wind Speed and Altitude
Students construct, read and interpret tables, charts and graphs. They draw inferences and develop convincing arguments that are based on data analysis. They create a graph displaying altitude versus wind speed.
Curated OER
Speedy Readers
Young scholars read orally to increase their reading speed and fluency in this lesson. They listen to the teacher model expressive and fluent reading. They then practice reading orally with a partner. The partner times their reading...
Curated OER
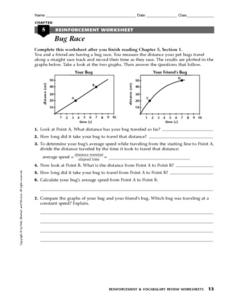
Bug Race
For this motion worksheet, students compare two graphs showing a bug's distance traveled over time. Students calculate the average speed of the bugs and determine which bug was traveling at a constant speed. This worksheet has 1 short...
Curated OER
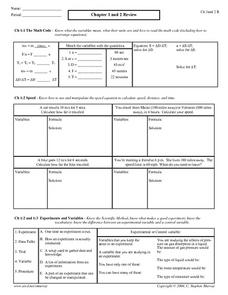
Chapter 1 and 2 Review
In this physics review worksheet, students complete 24 matching and problem solving questions pertaining to math code, speed, experiments and variables, slope, and acceleration and average speed.
Curated OER
Motion
In this motion instructional activity, students will read 8 statements about displacement and velocity and determine if the statement is true or false. Then students will fill in the blank for 8 statements on motion. Finally, students...
Curated OER
Home Run Reader
Students work to improve reading fluency. They complete one-minute timed readings with a partner--one student reads and the other times him using a stopwatch. They reverse roles several times and then repeat, documenting their progress.
Curated OER
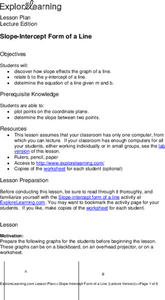
Slope-Intercept Form of a Line
Young scholars determine how the slope affects the graph of a line. They relate "b" to the "y"-intercept of a line and solve the equation of a line given "m" and "b." They are given scenarios and possible answers to which they explain...
Illustrative Mathematics
Robot Races
Analyze data on a graph to answer three questions after a robot race. Learners practice comparing ratios and reading points on a graph. Answers may vary on the last question based on accuracy of graphing. Use the instructional activity...
College Board
Frozen in Time
Take a closer look at increasing and decreasing behavior by zooming in on graphs. An AP® Calculus reference document examines how increasing/decreasing behavior should be considered in terms of intervals rather than points. The resource...
Mathed Up!
Histograms
Class members explore how to read and use histograms by watching a video on creating and analyzing histograms. To finish, the class works on a set of questions that tests these skills.
Curated OER
Measuring the Speed of a Wave
Students create an experiment in which they measure the speed of a wave and record the data in a graph. They work in small groups to write the procedure for the experiment and share it with another group for cross checking of the...
Curated OER
Getting to Know Saturn: Moons, Rings, and Relationships
Students identify the different objects that orbit Saturn. In this space science lesson, students plot the graph of orbital speed and distance. They explain why planets and asteroids remain in orbit around the sun.
Curated OER
Wind
Learners make a wind vane, anemometer, wind spiral, and wind streamer to calculate wind movement. In this wind lesson plan, students test each of their wind instruments, and graph the results of the wind speed in different locations.
Physics Classroom
A Wiggle in Time Lab
Though an alternative method is suggested, the best way to carry out this investigation is with the use of a computer-interfaced motion detector. Physics fanatics hang a mass on the end of a spring and analyze its motion verbally,...
Curated OER
Slope-Intercept Form of a Line
Using the subscriber website Explorelearning.com, young mathematicians observe changes in the slope and y-intercept and their effect on the graph of lines. This activity helps students develop an intuitive sense of the connection between...
National Energy Education Development Project
Introduction to Solar Energy
People have been using solar energy for many generations to dry crops, heat homes, and for light. This presentation explains how now it is possible to capture the solar energy and store it for future use, details how and where people use...
Curated OER
Practicing Smarter Not Harder is Best!
Students increase their reading fluence through repeated reading of a selected, leveled passage. Working in pairs, students read a grade level appropriate text in one-minute intervals. After reading they determine their fluency through a...
Illustrative Mathematics
Walk-a-thon 2
During a walk-a-thon your learners must determine the walking rate of Julianna's progress. Using tables, graphs, and an equation, they must be able to calculate the time it took her to walk one mile and predict her distance based on the...
Curated OER
Module 7 Revision Guide - Chemistry
Two versions of this handout are provided, the second with more detailed information on the same topics. Chemistry aces survey chemical reactions, heat energy transferred, and the action of enzymes by reading this resource. You can...
Kenan Fellows
Sensors, Sensors…..Everywhere! Middle School Meteorologist Create Weather Bots!
My forecast is that you'll want to use the resource. Pupils design and create a weather bot as part of a project-based unit. These bots should be able to measure temperature, humidity, barometric pressure, wind speed and direction, and...
Physics Classroom
Action-Reaction Lab
Computer-interfaced motion detectors are required to carry out this inquiry. It is a new twist on exploring motion with plunger carts: they are set back-to-back and then propelled away from each other. Their velocities are measured, and...


