Southern Nevada Health District
Is It Fruit?
The concept is the most valuable feature of this resource, which is designed to bring learners' attention to the nutritional labels of food items. Your class will take a closer look at the labels on bottled juice containers to determine...
Curated OER
Graphing Favorite Fruit
Third graders take poll and sort data, enter the data to create a spreadsheet and create bar and pie graphs.
Curated OER
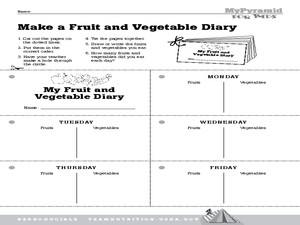
Lesson 3: Vary Your Veggies and Focus on Fruits
Learners explore fruits and vegetables. In this nutrition instructional activity, students generate a list of all known fruits and vegetables. Learners cut out and compile pages for a weekly fruits and vegetable journal. Students...
Curated OER
Importance of Fresh Vegetables and Fruits in Our Diets
Students explore the importance of fruits and vegetables in our diets. In this science activity, students discuss various types of fruits and vegetables. Students play the good health=good diet game. Students discuss types of fruits and...
Agriculture in the Classroom
The Garden Chef
Introduce young chefs to nutritious eating with a cookbook that is divided into sections focusing on one of the five food groups. It includes lessons, activities, and recipes. How wholesome!
Kelly's Kindergarten
June Daily Activities
This is an absolute must-have resource for early elementary teachers! Here you'll find a collection of activities and worksheets for each day of the month of June, with topics ranging from ordering numbers on a calendar or identifying...
Curated OER
Pictograph to Bar Graph
Second graders explore organizing data to make it useful for interpreting picture graphs and bar graphs. They use Graphers software to create a pictograph and a bar graph.
Illustrative Mathematics
Peaches and Plums
According to the resource graph, which costs more: peaches or plums? Algebra learners compare two proportional relationships and then throw in a banana. Leaving out the scale helps students become intuitive about graphing.
Bowland
Fruit Pies
Scholars use formulas for the area of a circle and the area of a rectangle to determine the number of pies a baker can make from a particular area of dough. They must also take into account rolling the remaining dough into a new sheet.
Curated OER
Analyzing Health
Third graders analyze their health. In this analysis lesson plan, 3rd graders rate their health on a 1-10 scale. They then tally the scores from the class and create a data chart. Then they answer true and false questions based on...
Curated OER
Who's Coming to Lunch: A Study of Mold Growth
Students participate in an experiment to determine where fungi and molds are formed, and create graphs documenting fungal growth.
Curated OER
Collect and Organize Data: Reteach
In this data collection worksheet, students learn the parts of a tally chart and how it organizes information. Students then use the second tally chart to help them answer the six questions.
Curated OER
Nutrition: A Thematic Unit
Young learners explore nutrition and the food groups in these two mini-lesson plan ideas. First, kindergarteners have a discussion about their health and how different foods contribute to it before making their own personal food pyramid....
Curated OER
Data Analysis and Froot Loops
Use this probability and graphing lesson to have your learners work with a partner to make a necklace out of Froot Loops. They record the cereal colors randomly chosen and strung, graph their data, then use a ratio formula to determine...
Curated OER
Weighted Averages
Weighted averages can be tricky to explain! However, this study guide makes it easy for teachers by including definitions, explanations, and breaking down problems into three steps. Includes mixture problems and uniform motion problems.
Curated OER
The Fabled Maine Winter
Students graph and analyze scientific data. In this research instructional activity students use the Internet to obtain data then draw conclusions about what they found.
Curated OER
Fractions in Action
Investigate equivalent fractions with your class. They compare and order fractions. Then they work cooperatively in groups to experiment and problem solve with fractions using a game format. Multiple resources are provided.
Curated OER
Seed Transport
Students explore botany by completing KWL worksheets. In this seed transportation lesson, students define a list of vocabulary terms associated with botany and seedlings before completing worksheets based on assigned text. Students...
Curated OER
Understanding Fair Trade
Fourth graders work in groups to research fair trade products from various countries in the world. In this fair trade lesson, 4th graders work in 5 groups and make a chart or graph to detail the important information from their handout....
Curated OER
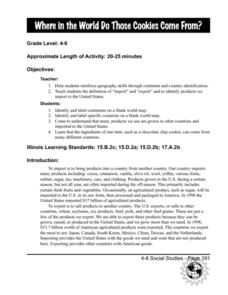
Where in the World Do Those Cookies Come From?
Learners discuss exports and imports by discovering where the ingredients come from for making chocolate chip cookies. They take a survey of their favorite cookies and create a bar graph to represent the information.
Curated OER
Collect Your Own Drosophila Lab
Learners study Drosophila by catching them. They construct catcher-containers to catch Drosophila using fruit as bait. After collection, they examine the flies and collect data to be displayed.
Curated OER
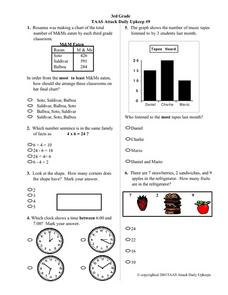
3rd Grade TAAS Attack Daily Upkeep #9
In this math literacy worksheet, 4th graders practice interpreting the pictographs in order to assemble the information to find the solutions to the 13 problems.
Curated OER
Effects of Bread Sanitary Conditions on Mold Growth
Students examine fungi and where it comes from. For this mold lesson students determine the percentage of fruit juice in a fruit then identify the different types of mold.
Curated OER
How Plants Spice Up Our Lives
Third graders study plants. In this biology lesson plan, 3rd graders label and identify parts of plants, identify spices obtained from plants, and determine what part of a plant a spice comes from by using taste, touch, smell and sight.


