Curated OER
Using Data from Sensors
Beginning with a discussion about using technology to collect data, this resource includes a video about the next Mars rover as an example. Young scientists are taught that filtering is necessary before collected data can be analyzed....
EngageNY
Evaluating Reports Based on Data from an Experiment
They say you can interpret statistics to say what you want them to. Teach your classes to recognize valid experimental results! Pupils analyze experiments and identify flaws in design or statistics.
EngageNY
Estimating Probabilities by Collecting Data
Take a spin to determine experimental probability. Small groups spin a spinner and keep track of the sums of the spins and calculate the resulting probabilities. Pupils use simulated frequencies to practice finding other probabilities to...
CK-12 Foundation
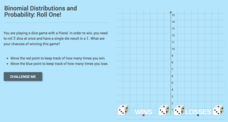
Binomial Distributions and Probability: Roll One!
It takes exactly one to win. Pupils calculate the probability of rolling five dice and having only a single die come up with a one. Learners calculate the number of expected wins out of a series of games. The interactive provides...
Fort Bend Independent School District
Data Analysis - AP Statistics
What better way to study survey design than to design your own survey! Bring a versatile data analysis project to your AP Statistics class, and encourage them to apply the practices from their instructions to a real-world survey project.
NASA
Erosion and Landslides
A professional-quality PowerPoint, which includes links to footage of actual landslides in action, opens this moving lesson. Viewers learn what conditions lead to erosion and land giving way. They simulate landslides with a variety of...
K20 Learn
Bavaria Has Issues...Experimental Components
New ReviewDo you want to be a detective by analyzing situations? An engaging lesson provides young historians with the tools to help them understand the difference between data types and how to analyze them to draw conclusions. Scholars complete...
Curated OER
Probability Experiment Simulation: Design and Data Analysis Using a Graphing Calculator
Seventh graders simulate probability experiments. Using a graphing calculator, 7th graders design, conduct, and draw conclusions from simulations or probability experiments. Students construct frequency tables and compare the...
Math Warehouse
Theoretical Probability Activity
If you keep rolling a die, you'll roll a five exactly one-sixth of the time—right? A probability lesson prompts young mathematicians to roll a die 100 times and use the data to calculate empirical probabilities. They then compare these...
Radford University
Connecting Theoretical and Experimental Probability
Play some games, develop a law, and then call it a day. Learners first perform a small number of trials for a probability experiment, then predict the result for a larger number of trials. They then compile data from the entire class to...
Curated OER
Energy Audit
Students collect data about energy usage and use mathematical calculations to analyze their data. In this energy conservation and statistics math lesson, students survey their homes to complete an energy usage worksheet. Students...
Curated OER
Independent Plant Growth Experiment
This is an awesome lesson filled with tons of engaging learning activities. Over a period of weeks learners will make observations, collect plant and analyze plant data, read and review agricultural articles, design and conduct an...
Curated OER
Evaluating Data
In this data worksheet, students learn how to organize the data collected during an experiment and practice finding patterns. Students graph a table of experimental data and complete 1 short answer question.
EngageNY
Drawing a Conclusion from an Experiment (part 1)
Challenge your classes to complete an experiment from beginning to end. Learners make their own hypotheses, collect and analyze their own data, and make their own conclusions. They are on their way to becoming statisticians!
American Statistical Association
Don't Spill the Beans!
Become a bean counter. Pupils use a fun activity to design and execute an experiment to determine whether they can grab more beans with their dominant hand or non-dominant hand. They use the class data to create scatter plots and then...
American Statistical Association
Colors Challenge!
Does writing the name of a color in a different colored ink affect one's ability to read it? Scholars design an experiment to answer this question. They collect the data, analyze the statistics, and draw a conclusion based on what they...
Curated OER
Generating Hypotheses and Experimental Design 1
Here is a thorough exercise in forming hypotheses for scientific investigations. Young scientists consider factors that may be related to the question they would like to address. They think through measurable changes that may result from...
American Statistical Association
Bear Hugs
Scholars research arm span to determine who gives the best bear hugs. They use data from a national study to find the standard statistics for arm span. It includes mean, median, quartiles, spread, standard deviation, and more.
Teach Engineering
Combustion and Air Quality: Emissions Monitoring
Help your class determine the types of pollutants coming from vehicle exhaust. Groups use an air quality monitor to determine the emissions from different vehicles, to gain knowledge about combustion energy, and to predict how the...
Curated OER
Where Did the Bunny Leave the Eggs? Picture Graphing Activity
The Easter Bunny left us a bunch of eggs, but how many did he leave? Learners use the data to create a picture graph, interpret it, and answer the questions that follow. There's even easy egg cut-outs for your youngsters!
Curated OER
Experimental Design Practice
In this experimental design worksheet, students are given two experimental scenarios to read. They answer questions about each including finding the hypothesis, the independent and dependent variables and controls. They design a graph...
Curated OER
Science Skills and Experimental Design
In this experimental design worksheet, learners describe the different science skills required when designing an experiment. Then students create a flipbook with the information. This worksheet has 9 short answer questions.
EngageNY
Ruling Out Chance (part 1)
What are the chances? Teach your classes to answer this question using mathematics. The first part of a three-day lesson on determining significance differences in experimental data prompts learners to analyze the data by determining the...
EngageNY
The Difference Between Theoretical Probabilities and Estimated Probabilities
Flip a coin to determine whether the probability of heads is one-half. Pupils use simulated data to find the experimental probability of flipping a coin. Participants compare the long run relative frequency with the known theoretical...


