Inside Mathematics
Sorting Functions
Graph A goes with equation C, but table B. The short assessment task requires class members to match graphs with their corresponding tables, equations, and verbalized rules. Pupils then provide explanations on the process they used to...
Curated OER
Profitable Soda Stand
Am I making any money? Help learners determine if their fictitious soda stand is turning a profit. They graph linear equations using the slope and y-intercept and identify the best price to use to sell soda. They identify the domain and...
Mathematics Vision Project
Module 2: Linear and Exponential Functions
Write, graph, and model all things linear and exponential. Building on the previous module in a nine-part Algebra I series, learners compare linear exponential modeling. They write equations, graph functions, and analyze key features.
Mathematics Vision Project
Module 5: Features of Functions
The language and features of functions get careful treatment in a complex but doable lesson. Learners get a lot of practice really figuring out what a graph means in context, and also identifying key features of graphs. Key ideas like...
Virginia Department of Education
Functions 1
Scholars learn what it means for a relation to be a function and see various representations of functions. After learning the definition, they participate in a card sorting activity classifying relations as functions or not.
CK-12 Foundation
Algebraic Functions: Vertical Line Test
To be (a function) or not to be (a function). An easy-to-use interactive has pupils drag a vertical line onto several graphs to determine if they represent functions. Some challenge questions assess understanding of this idea.
West Contra Costa Unified School District
Using Derivatives to Graph Polynomials
You can learn to graph as well as a calculator using calculus. The lesson introduces using derivatives to find critical points needed to graph polynomials. Pupils learn to find local maximums and minimums and intervals of increase and...
Curated OER
Graph, Identify Asymptotes, Find Domain and Range, for Eleven Simple Rational Functions
Using this worksheet, pupils graph 11 simple rational functions. They also find asymptotes, domain, and range for each function. The solutions are provided.
EngageNY
Revisiting the Graphs of the Trigonometric Functions
Use the graphs of the trigonometric functions to set the stage to inverse functions. The activity reviews the graphs of the basic trigonometric functions and their transformations. Pupils use their knowledge of graphing functions to...
Curated OER
Bouncing Ball : Function Families
A bouncing ball serves as more than entertainment when learning to apply quadratic functions to real-world events. This is the second of a two-part lesson, which can also be accessed from the website. The instructions say to measure the...
Curated OER
Matchstick Math: Using Manipulatives to Model Linear, Quadratic, and Exponential Functions
Playing with matches (unlit, of course) becomes an engaging learning experience in this fun instructional unit. Teach pupils how to apply properties of exponential functions to solve problems. They differentiate between quadratic and...
Curated OER
Functions - Intro and Inverses
Define the terms domain, range, function, vertical limit test, and linear function notation with your class. They can then, graph several equations applying the vertical line test to determine which are and which are not functions, write...
Curated OER
Mystery Liquids: Linear Function
High schoolers determine the linear equations of the density of water and oil by collecting data on the mass of various volumes of each liquid. They construct scatter plots from the data and use these to write the linear equations for...
University of California
Student Workbook: Algebra and Functions
A smorgasbord of functions, this packet has the basics required for your learners to be successful in the land of early algebra. The packet includes solving equations, graphing, evaluating, simplifying and basically everything else in...
EngageNY
Basic Trigonometric Identities from Graphs
Have young mathematicians create new identities! They explore the even/odd, cofunction, and periodicity identities through an analysis of tables and graph. Next, learners discover the relationships while strengthening their understanding...
Inside Mathematics
Graphs (2004)
Show your pupils that perimeter is linear and area is quadratic in nature with a short assessment task that requests learners to connect the graph and equation to a description about perimeter or area. Scholars then provide a...
West Contra Costa Unified School District
Families of Functions Sort
Have some fun with functions with a short activity that asks learners to first sort scatter plot in terms of their correlation. They then sort graphs of different types of functions in terms of key features, such as slope.
Curated OER
Rational Functions
Through a mini assessment, students identify and list the vertical and horizontal asymptotes for the given rational functions and determine the type of asymptote of a given rational function. They also decide which form of a function...
Curated OER
Fast Talker - Ch 2 project
Tongue Twisters?! Create scatter plot graphs based on timing fellow classmates saying tongue twisters. Then investigate, display, and analyze the relationships based on functions. Wrap up this activity by making a poster or other...
Curated OER
Piecewise Practice Problems
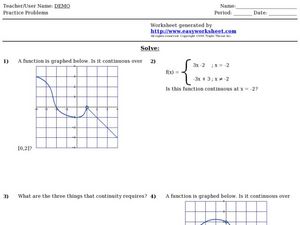
In this algebra worksheet, students validate continuity of a graph by a defined interval as well as determine continuity of a piecewise function.
Curated OER
Exploring Quadratic Data with Transformation Graphing
Using a data collection device to collect data regarding a bouncing ball, learners use various features on graphing calculators to experiment with the parameters of the vertex form of the parabola and their effect on the shape of the...
EngageNY
Inverse Functions
Undo the functions. Learners refresh their knowledge of inverses of functions from Algebra II in the 19th section of a 23-part Precalculus unit. Pupils look at inverses in tables and graphs. They then add to their understanding of...
CK-12 Foundation
Quadratic Functions and Equations
The form of a quadratic function paints a picture of its graph. Young mathematicians explore this connection by locating key features on a graph and then writing the corresponding equations. The interactive tutorial highlights key...
Curated OER
Representation of Quadratic Functions
Students use a table, graph or equation to represent a quadratic function. In this algebra lesson, students model and graph with quadratic function. They become comfortable representing quadratics using different methods.


