Education Development Center
Geography of the Coordinate Plane
Put the graph into graphing and allow learners to understand the concept of point plotting and how it relates to data. The worksheet provides a nice way to connect data analysis to a graph and make predictions. The worksheets within the...
EngageNY
Perimeter and Area of Polygonal Regions in the Cartesian Plane
How many sides does that polygon have? Building directly from lesson number eight in this series, learners now find the area and perimeter of any polygon on the coordinate plane. They decompose the polygons into triangles and use Green's...
EngageNY
Perimeter and Area of Triangles in the Cartesian Plane
Pupils figure out how to be resourceful when tasked with finding the area of a triangle knowing nothing but its endpoints. Beginning by exploring and decomposing a triangle, learners find the perimeter and area of a triangle. They then...
Virginia Department of Education
Graphing Linear Equations
Combine linear equations and a little creativity to produce a work of art. Math scholars create a design as they graph a list of linear equations. Their project results in a stained glass window pattern that they color.
Curated OER
Lesson 2-5: Absolute Value Functions and Graphs
What is absolute value? What is an absolute value function? Emerging mathematicians solve equations containing variables inside an absolute value sign. They graph each function on a coordinate plane and identify the maximum and minimum...
Illustrative Mathematics
Graphs of Quadratic Functions
The equations look different, but their graphs are the same. How can that be? This activity leads your mathematicians in an exploration of three different forms of the same quadratic function. After comparing the equations, their graphs,...
Curated OER
Systems of Equations and Inequalities
This is a comprehensive lesson on creating and solving equations and systems of equations and inequalities. Problems range from basic linear equations to more complex systems of equations and inequalities based on a real-world examples....
Illustrative Mathematics
Chocolate Bar Sales
In this real-world example, algebra learners start to get a sense of how to represent the relationship between two variables in different ways. They start by looking at a partial table of values that define a linear relationship. They...
Agile Mind
Transforming Graphs of Quadratic Functions
In the activity on this webpage, learners use interactive graphing technology to investigate transformations of graphs. In the first part of the task, they look at the graph of a quadratic function with coordinates of a few points...
Illustrative Mathematics
Transforming the graph of a function
This activity guides learners through an exploration of common transformations of the graph of a function. Given the graph of a function f(x), learners generate the graphs of f(x + c), f(x) + c, and cf(x) for specific values of c. The...
Illustrative Mathematics
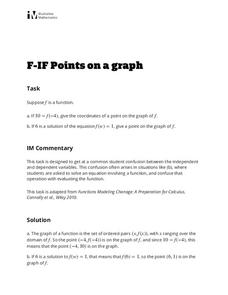
Points on a Graph
Learners practice using their knowledge of how to interpret a function and use function notation. The activity includes two questions. Given an input of a function and its output, the first question asks learners to write the ordered...
EngageNY
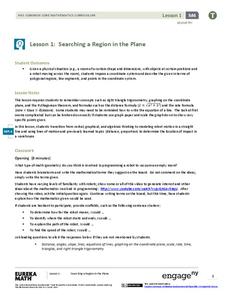
Searching a Region in the Plane
Programming a robot is a mathematical task! The activity asks learners to examine the process of programming a robot to vacuum a room. They use a coordinate plane to model the room, write equations to represent movement, determine the...
Concord Consortium
Function Project
What if a coordinate plane becomes a slope-intercept plane? What does the graph of a linear function look like? Learners explore these questions by graphing the y-intercept of a linear equation as a function of its slope. The result is a...
Blogger
Standard Form of a Linear Equation
Organize your learners with this well-laid-out note-taking printable. Note blanks are organized to allow for two strategies of graphing an equation given in standard form.
EngageNY
Lines That Pass Through Regions
Good things happen when algebra and geometry get together! Continue the exploration of coordinate geometry in the third lesson in the series. Pupils explore linear equations and describe the points of intersection with a given polygon as...
EngageNY
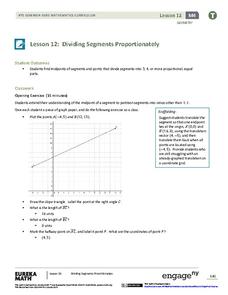
Dividing Segments Proportionately
Fractions, ratios, and proportions: what do they have to do with segments? Scholars discover the midpoint formula through coordinate geometry. Next, they expand on the formula to apply it to dividing the segment into different ratios and...
EngageNY
Perimeter and Area of Polygonal Regions Defined by Systems of Inequalities
When algebra and geometry get together, good things happen! Given a system of inequalities that create a quadrilateral, learners graph and find vertices. They then use the vertices and Green's Theorem to find the area and perimeter of...
Curated OER
Narrow Corridor
Buying a new sofa? Learn how to use the Pythagorean Theorem, as well as algebra and graphing techniques, to determine whether the sofa will fit around a corner (which I'm sure you'll agree is a very important consideration!).
Achieve
Rabbit Food
Keep your pets slim, trim, and healthy using mathematics! Pupils use a linear programming model to optimize the amount and type of food to provide to a pet rabbit. They model constraints by graphing inequalities and use them to analyze a...
Education Development Center
Points, Slopes, and Lines
Before graphing and finding distances, learners investigate the coordinate plane and look at patterns related to plotted points. Points are plotted and the goal is to look at the horizontal and vertical distances between coordinates and...
Illustrative Mathematics
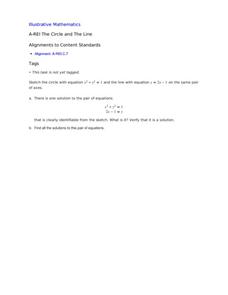
The Circle and The Line
Here is a resource where algebra learners show their understanding of a system of equations involving a circle and a line. Once graphed, learners see two points of intersection, one where the ordered pair is read, and a second where...
It's About Time
How Do Carbon Dioxide Concentrations in the Atmosphere Affect Global Climate?
Does carbon dioxide really affect temperatures across the world? This fifth installment in a six-part series investigates the relationship between carbon dioxide and global temperatures. Graphs created from genuine data help young...
Illustrative Mathematics
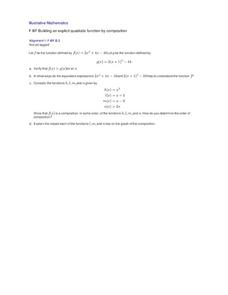
Building an Explicit Quadratic Function by Composition
Use an activity to illustrate the different forms of a quadratic function. Here, the task asks learners to use composition of given functions to build an explicit function. The process emphasizes the impact of the order of composition...
SHS Algebra
Linear vs. Exponential Functions Tasks
Your algebra learners will enjoy the real-life application of the three tasks presented here. They complete a table and a graph comparing the two options presented. One option is linear, while the other is exponential. After coming up...
Other popular searches
- Coordinate Graphing Pictures
- Holiday Coordinate Graphing
- Graphing Coordinate Planes
- Coordinate Graphing Worksheets
- Cartesian Graphing Pictures
- Coordinate Graphing Art
- Using Coordinate Graphing
- Coordinate Graphing Practice
- Algebra Coordinate Graphing
- Coordinate Graphing Distance
- Graphing Coordinate Pairs
- Graphing on a Coordinate Grid


