Graphs and Tables Teacher Resources
Hi, What do you want to do?
Find Graphs and Tables lesson plans and worksheets
Showing 402 resources
Curated OER
Ohio Census 1990 & 2000
Students use Ohio census data to solve problems, make comparisons, draw conclusions, and support predictions related to Ohio's population. They interpret and work with pictures, numbers and symbolic information.
Curated OER
Owning a Pet
Fourth graders identify and use different forms of writing for various purposes. Using the internet, they read and gather information and write quesitons for their own investigations on the various pets they could own. They practice...
Curated OER
Pumped Up Gas Prices
Students spend one month keeping track of the mileage and gasoline amounts they or their family has used. Information is entered into a spreadsheet to help calculate the average gas prices over time.
Curated OER
Social Studies: Canadian City Comparison
Learners research Canadian population distribution while comparing and contrasting the quality of life in two cities. They discuss issues and problems that cities and rural towns face. Students apply various methods, such as graphs and...
Curated OER
Data Analysis, Probability, and Statistics: Exploring Websites
Students measure their pulse rates and place the number on the board. They arrange the numbers in order and discuss the differences between isolated facts and data. Students explore websites that relate to data analysis and report their...
Curated OER
Closer To the Ground Lesson 2: Providing a Helping Hand
Students examine how businesses and corporations contribute or sponsor activities for the common good. They read annual reports of major corporations to determine how they contribute to focused activities for the common good.
Curated OER
Michigan Fun Facts
Fourth graders work with a partner to plan, rese,a rch design and publish a
slide show that depicts the most important or interesting facts they
have learned about Michigan. They are given the choice of working in
one of the seven...
Curated OER
On the Surface
Students draw and label the 15 major rivers in Texas. They then draw and label another map with the major lakes and reservioirs of Texas. Students use the maps and locate and label the location of the following major Texas cities:...
Curated OER
Drip, Drip, Drip
Students gather scientific data and be able to utilize the data to generalize results over a long period of time. They use the appropriate tools to measure quanities of liquids and analyze the data to determine the cost of a leaky faucet.
Curated OER
Civil War Letter Web
Students use the internet to gather information on a specific Civil War battle of interest to them. Using the information they gather, they organize it into a web to be used later when writing a letter. They use the web to write their...
Curated OER
Conducting A Survey
Students identify the types of information gathering styles and different surveying styles. They distribute a survey around your school to determine the different forms of transportation used to get to school.
Curated OER
"If You Hopped Like a Frog" by David M. Schwartz
Students brainstorm several animal/personal scenarios, select one, and write out an explanation of the comparison. They apply the measurements/characteristics to themselves and use algebraic equations to demonstrate the comparison.
Curated OER
Like Waves on the Shore: Settling Canada
Pupils examine and discuss past and current migration patterns in Canada. Using populatioon maps they complete a worksheet on migration waves.
Curated OER
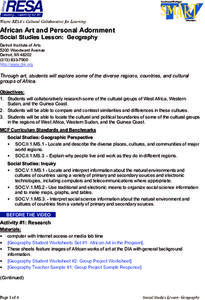
Geography
Students work together in groups to research the cultural groups of West Africa, Sudan and the Guinea Coast. They compare and contrast each culture and locate the political and cultural boundaries on a map.
Curated OER
Oregon City: A Convergence of Endings
Students describe the activities that occurred in the Willamette Valley before the establishment of the Oregon Trail and agricultural settlement and explain the impact that American settlement had on the landscape and native groups who...
Curated OER
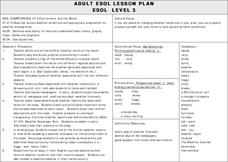
Weather Conditions
High schoolers list and name various kinds of weather conditions occurring in their city. Using the newspaper as a resource, students answer questions relating to written weather reports. This lesson is intended for high schoolers...
Curated OER
Energy Choices
Students add and multiply decimals to complete gas choice worksheets. They discover which gas supplier has the best gas prices. Students collect and interpret data about local natural gas suppliers and use this information...
Curated OER
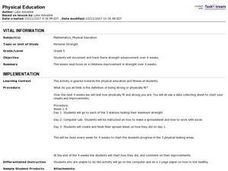
Strength Building
Fifth graders go to each of the 3 stations testing their maximum strength and then make a spreadsheet and how to work with excel. Students create and finish their spread sheet on how they did on day 1.
Curated OER
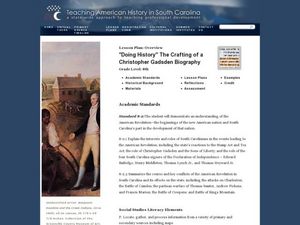
"Doing History" The Crafting of a Christopher Gadsden Biography
Students reflect on the biography of General Gadsden. In this history lesson, students read the biography of General Gadsden then research a specific aspect of the Generals life to complete their own biography pn him.
Curated OER
Budgeting 101
Students identify various sources of income and discern between needs and wants as they also learn to create a personal budget. In this personal budget instructional activity, student understand financial scenarios as they relate...
Curated OER
Ideas and Commodities Cross Cultural Regions
Students compare and contrast how commodities native to certain countries have impacted the economies of other nations. After gathering information regarding how commodities are grown and traded, students use their information to...
Texas Education Agency
Texas Gateway: Determining Slopes From Equations, Graphs, and Tables
Given algebraic, tabular, and graphical representations of linear functions, the student will determine the slope of the relationship from each of the representations.
Khan Academy
Khan Academy: Evaluate Composite Functions: Graphs & Tables
Given the graphs, or some tables of values, of two functions, evaluate the composition of those functions at a given input.
Texas Instruments
Texas Instruments: Linear Equations: Using Graphs and Tables
Students learn to locate the real number solution of a linear equation using tables. They also learn to locate the real number solution of a linear equation using graphical method on a Cartesian (x-y) graph.
Other popular searches
- Tables, Charts and Graphs
- Function Tables and Graphs
- Tables and Graphs
- Tables Charts and Graphs
- Create Data Tables From Graphs
- Math Tables and Graphs
- Reading Tables and Graphs
- Data Displays and Graphs
- Tables, Graphs, Charts
- Using Graphs and Tables
- Making Tables and Graphs
- Data Tables and Graphs
