Charts and Graphs Teacher Resources
Find Charts and Graphs lesson plans and worksheets
Showing 610 resources
Curated OER
Learn How to Graph
Learners examine various types of charts and discover how to construct a line graph. Using graph paper, they construct a graph displaying weight loss over a five-year period. They draw copnclusions from the completed graphs.
Curated OER
Weather Watchers
Second graders discuss what weather is and list words that can be used to describe weather. For this science lesson, 2nd graders develop symbols for each type of weather and record the weather for two weeks at the same time and the same...
Curated OER
Black History Project
Third graders explore and analyze about famous African-Americans by listening to four picture book biographies. They generate a list of 15 famous African-Americans and then create a survey to rank them according to importance of...
Curated OER
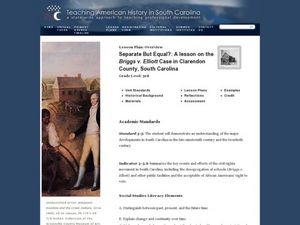
Separate But Equal? A Lesson on the Briggs v. Elliott Case in Claredon County, SC
Third graders discussschool integration. In this racial inequality lesson, 3rd graders read Remember: The Journey to School Integrationand discuss the school facilities and how people must have felt. Students watch a...
Curated OER
Traveling Southern Style: A Lesson on the Jim Crow Laws
Third graders create a poster of a travel route. In this discrimination lesson, 3rd graders read The Gold Cadillac and use it to discuss the problems African Americans faced while traveling south in the 1950's. Students compare three...
Curated OER
Off to Work We Go!
Students create a book about The Great Depression in West Virginia. In this West Virginia history lesson, students visit the West Virginia State Museum, answer questions about West Virginia history, and create a book entitled...
Curated OER
Surveying the Land
Students explore the different kinds of maps and the purpose of each. In this Geography lesson, students work in small groups to create a map which includes the use of a map key.
Curated OER
Factoring Trinomials
Students factor trinomials using algebra tiles and blocks. In this algebra lesson, students complete a trinomials station activity. They work backwords to find their answers and discuss their steps in a group.
Curated OER
HEART THROBS
Students predict what might happen to their pulse rates after physical exertion and then make conclusions about the effects of physical activity on pulse rates.
Curated OER
Virtual Field Trip: Lesson Ten - Publishing
Class members publish a letter describing their Virtual Field Trip incorporating data from previously developed charts, graphs, and data tables. The final lesson in a series devoted to collecting information and publishing data.
Curated OER
Microsoft Office Excel
Students use Microsoft Office Excel. In this technology instructional activity, students enter data on a spreadsheet using Excel. This programs tallies data and presents it using graphs.
Curated OER
Yummy Apples!
Young scholars discuss apples and how they are grown. They listen as the teacher reads "Apples," by Gail Gibbons. Students discuss the story. They view several different types of apples and compare their characteristics. Young scholars...
Curated OER
T-Shirt Lettering
Students determine the cost of a t-shirt using a variety of mathematical operations to solve problems. Then they use a spreadsheet to calculate the cost of lettering a t-shirt and display this information in a graph.
Curated OER
Technology Blackout Day
Students describe the impact of modern technology inventions on daily life. They create a graph of the class's favorite item of technology and draw a picture of their favorite piece of modern technology.
Curated OER
Making and Interpreting Tables
For this data tables worksheet, students make and interpret data tables given data about magazine sales. They categorize their data, complete their data table and answer questions about their data.
Curated OER
Population Pyramid
Students learn about demographic population pyramids. They then design and fictitious nation and draw its population pyramid.
Curated OER
The Perfect Principal
Students demonstrate their understanding of math skills. In this data analysis lesson, students complete a worksheet requiring them to calculate mean, median, and mode, and create and interpret graphs. Lesson is intended as an assessment...
Curated OER
The Battle of Fort Moultrie
Eighth graders interpret historical evidence presented in primary and secondary resources. In this American Revolution lesson, 8th graders examine the Battle of Fort Moultrie and create their own historical narratives regarding the event.
Curated OER
Revolutionary Women of South Carolina
Students examine multiple primary sources. In this revolutionary war lesson, students read case studies regarding women from South Carolina. Students will compare the different roles women played during the Revolutionary War. Students...
Curated OER
General Greene to General Marion: Your State is Invaded, Your All is at Stake
Third graders examine the contributions of Francis Marion and Nathaneal Greene. In this Revolutionary War instructional activity, 3rd graders use primary and secondary sources to research Marion and Greene and the accomplishments of...
Curated OER
The Good, The Bad, The Ugly
Sixth graders examine the causes of the stock market crash of 1929. For this integrated math/history unit on the stock market, 6th graders study, research, and read stocks, visit a local bank, and create a PowerPoint to show the...
Curated OER
Is That a Bird in Your Hat?
Second graders imagine they find an injured bird. They create a clay bird and nest to stimulate creative writing. The lesson includes an integrated week-long art, science, and writing activity.
Curated OER
Too Free, Or Not Too Free?
Students create a survey that examines what level of electronic surveillance might be acceptable to members of the school and community. They poll the community, and analyze the results in the form of graphs and a written news article.
Curated OER
Friction Flyers
Students explore the principles of magnetism and friction. They complete an interactive puzzle on the Gizmos and Gadgets computer software, construct a vehicle, build and modify ramps and vehicles to produce various outcomes, and...
Other popular searches
- Pie Charts and Graphs
- Reading Charts and Graphs
- Behavior Charts and Graphs
- Charts and Graphs Candy
- Interpret Charts and Graphs
- Charts and Graphs Christmas
- Charts and Graphs Math
- Analyzing Charts and Graphs
- Tables, Charts and Graphs
- Charts and Graphs Europe
- Using Charts and Graphs
- Bar Graphs and Charts


