Cartesian Coordinates Teacher Resources
Hi, What do you want to do?
Find Cartesian Coordinates lesson plans and worksheets
Showing 2,772 resources
Curated OER
Translation and Rotation of Axes
Young scholars rotate axes to eliminate the xy-term and illustrate the dissectible cone as needed. They also discuss the discriminant for the second degree equation in two variables, as well as the translation of axes and rotation of...
Curated OER
Graphing Points Worksheet
In this graphing points activity, students plot ordered pairs on a coordinate plane. They graph 20 given problems, with 10 problems requiring students to graph two or more points.
Curated OER
Solution Sets
In this solution set worksheet, 9th graders solve 5 different problems that include graphing on the x- and y-axis. First, they solve each inequality as needed. Then, students graph the solution set found in each on the coordinate plane...
Shodor Education Foundation
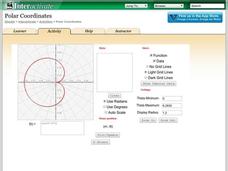
Polar Coordinates
Polar opposites might not work together—but polar coordinates do! The interactive provides learners the opportunity to graph trigonometric and algebraic functions using polar coordinates. The program takes either individual data points...
EngageNY
The Geometric Effect of Some Complex Arithmetic 1
Translating complex numbers is as simple as adding 1, 2, 3. In the ninth lesson in a 32-part series, the class takes a deeper look at the geometric effect of adding and subtracting complex numbers. The resource leads pupils into what it...
Curated OER
Slope, Vectors, and Wind Pressure
A hands-on lesson using the TI-CBR Motion Detector to provide information to graph and analyze. The class uses this information to calculate the slope of motion graphs and differentiate scalar and vector quantities. There is a real-world...
Curated OER
Coordinate Graphs
As you introduce coordinate graphs to scholars, be sure to use guided worksheets like this one. Using an example for guidance, they write the coordinates of five points on a graph, each distinguished as a shape symbol. Next, scholars do...
Curated OER
How Do You Find the X-Coordinate of a Point on a Line If You Have Another Point and the Slope?
Use the slope formula to find the missing coordinate. You've been given all the needed information to solve this problem. So all you need to do is plug in the values and solve for the missing variable value.
Curated OER
Coordinates
For beginning point plotters, these graphs give a good introduction. They examine a graph with shapes drawn onto it and each vertex labeled. There are 20 total, and scholars write the coordinates of each labeled point. All of these are...
Curated OER
Dilations and Similarity
In this dilations and similarity learning exercise, pupils solve 10 different problems that include various dilations. First, they determine the scale factor of dilations found in the illustrated graphs. Then, everyone determines the...
Curated OER
Easter Graphing Fun
Graphing can be festive! This Easter worksheet has scholars using coordinates to record the location of ten holiday images. The first is done for them, and the grid is large and appealing to younger learners. Consider visualizing this...
Illustrative Mathematics
Coordinates of Equilateral Triangles
Can it be constructed? The task poses the question whether it is possible to have an equilateral triangle with its vertices located at integer coordinates. Pupils work with their knowledge of trigonometric ratios and the Pythagorean...
Curated OER
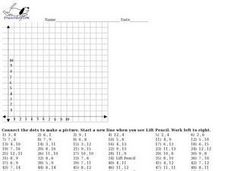
Graph Picture (Coordinate Pairs)
Coordinate graphing on a grid is the focus of this worksheet. Young mathematicians plot 42 coordinate pairs on a graphing grid, then connect the dots to make a picture. A fun way to get your learners involved in graphing!
Curated OER
Graph Picture (Coordinate Pairs) 2
Looking for an engaging way to encourage your class to practice graphing coordinate pairs? This might be the activity you are looking for! For this learning exercise, learners create a picture by plotting 54 coordinate pairs on graph and...
Curated OER
Graph Picture (Coordinate Pairs) 3
Here is a very good coordinate graphing worksheet. Learners practice graphing by plotting 58 coordinate pairs, then connecting the dots to reveal a picture. This resource could be used as an in-class activity or a homework assignment.
FuseSchool
Introduction to Graphs: Axis and Coordinates
Axis, coordinates, quadrants, oh my! Review graphing vocabulary with your classes with a quick video lesson. The instructor explains the vocabulary and provides problems for learners to try as they watch.
EngageNY
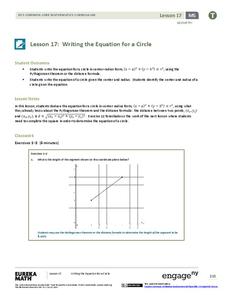
Writing the Equation for a Circle
Circles aren't functions, so how is it possible to write the equation for a circle? Pupils first develop the equation of a circle through application of the Pythagorean Theorem. The lesson then provides an exercise set for learners to...
EngageNY
Four Interesting Transformations of Functions (Part 1)
Understanding how functions transform is a key concept in mathematics. This introductory instructional activity makes a strong connection between the function, table, and graph when exploring transformations. While the resource uses...
3Blue1Brown
Vectors, What Even Are They? | Essence of Linear Algebra, Chapter 1
Take a look at vectors as geometric objects and then as an algebraic concept. The second video in a series of 15 introduces the vector using three perspectives: the physics, computer science, and mathematical. The resource shows the...
Mathematics Assessment Project
Square
Don't be a square! Young mathematicians determine the slope and length of a line segment. They then prove whether four given coordinate points form a square.
West Contra Costa Unified School District
Graphing Piecewise Functions
Step up to learn about step functions. The lesson, designed for high schoolers, first covers piecewise functions and how to draw their graphs. It then introduces step functions, including the greatest integer (floor) and...
Curated OER
What is the Domain of a Relation?
The teacher illustrates several ways to look at what the domain is in a set of numbers. Input, output, table, graphs, and diagrams are a few of the ways in which she illustrates the meaning of domain.
Curated OER
What is Domain?
The teacher illustrates several ways to look at what the domain is in a set of numbers. Input, output, table, graphs, and diagrams are a few of the ways in which she illustrates the meaning of domain.
Curated OER
Applications of the Pythagorean Theorem - Magnetism
Middle and high schoolers use the Pythagorean Theorem to complete a table showing with the magnetic field strengths in given cities. They find the average value of the Earth's magnetic field and plot one of the three-dimensional values...


