Curated OER
Integration: Statistics, Scatter Plots and Best-Fit Lines
In this math worksheet, students identify the type (if any) of correlation on 6 scatter plots. They use information given on a table to create a scatter plot and identify the type of correlation. Students use the scatter plot to make...
Curated OER
Graphing Data from the Chemistry Laboratory
Learners graph and analyze data using a spreadsheet.
Curated OER
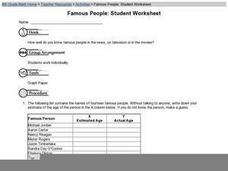
Famous People: Student Worksheet
Older learners consider a list of famous people, and they fill in two columns; one in which they guess the celebrities' ages, and another where they look up their actual age. They construct a graph by assigning one of the columns the x...
Curated OER
Best Guesser
Fifth graders develop strategies for estimating ages, and illustrate results by graphing and interpreting scatter plots to compare x and y coordinates.
Curated OER
Reaching New Heights
Learners explore the relationship between two variables. Students measure their arm span and height. They gather this class data to design a scatter plot. Learners interpret the meaning of individual coordinates and the overall graph....
Curated OER
Dinosaur Tracks: From Stride To Leg Length To Speed
Students determine the relationship between leg length, stride length, and speed in humans and bipedal dinosaurs. They collect data and graph these human characteristics then use actual data collected from dinosaur track pads and fossils...
Curated OER
Off to College
High schoolers investigate linear, quadratic and exponential equations using the TI calculator. They identify relation and functions using ordered pairs, graph the data, analyze the data, and relate it to real-world situations.
Curriculum Corner
8th Grade Math "I Can" Statement Posters
Clarify the Common Core standards for your eighth grade mathematicians with this series of classroom displays. By rewriting each standard as an achievable "I can" statement, these posters give students clear goals to work toward...
Curated OER
Lines of Fit
Students graph an equation and analyze the data. For this algebra lesson, students graph scatter plots and identify the line of best fit using positive correlation, negative correlation an d no correlation. They apply their data analysis...
Curated OER
Lines of Fit
Students graph an equation and analyze the data. In this algebra lesson, students graph scatter plots and identify the line of best fit using positive correlation, negative correlation an d no correlation. They apply their data analysis...
Curated OER
Lines of Fit
Learners solve equations dealing with best fit lines. In this algebra lesson, students solve problems by analyzing data from a scatterplot, and define it as positive, negative or no correlation. They classify slopes the same way as...
Curated OER
Properties of Logarithms
High schoolers explore the concept of logarithms. In this logarithms lesson, students discuss the logarithm properties. High schoolers use linear functions as a basis to develop the logarithm properites by substituting log b and log a...
Curated OER
Lines of Fit
Students analyze graphs. In this algebra lesson, students find the line of best fit, using scatter plots. They calculate the sale of popcorn as it relates to the price. They then analyze the graphs for positive, negative and no correlation.
Curated OER
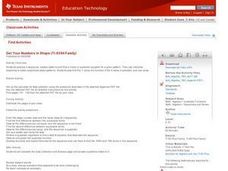
Get Your Numbers in Shape - TI-83
High Schoolers use the TI-83 calculator to produce a sequence, explore patterns and find a linear or quadratic equation for a given pattern. They use inductive reasoning to make conjectures about patterns. They find the Y-value of a...
Curated OER
Equations With Radical Expressions
Students solve systems of equations with radical expressions. After reading real life situation, they translate the problem into algebraic expressions. As a class, students solve quadratic equations and inequalities by graphing and...
Curated OER
The Closer I Get To You
Pupils explore the law of reflection. Through experimentation and problem solving, they collect and analyze data pertaining to reflection. The data is plotted on a graph and formulas for calculating the x and y values are evaluated.
Alabama Learning Exchange
The Composition of Seawater
Young scholars explore the concept of finding the composition of seawater. In this finding the composition of seawater instructional activity, students make a saturated salt water solution. Young scholars discuss why there is variation...
Willow Tree
Approximating a Line of Best Fit
You may be able to see patterns visually, but mathematics quantifies them. Here learners find correlation in scatterplots and write equations to represent that relationship. They fit a line to the data, find two points on the line, and...
Curated OER
Studying Fossils: Dinosaur Tracks From Stride to leg Length to Speed
Students explore dinosaurs. Students determine the relationship between leg length, stride length, and speed in humans and bipedal dinosaurs. Students analyze collected information. Based upon the data, dinosaur tracks, and fossils,...
Curated OER
Bungee Jump Lab
Student apply linear relationships to the real world. They use Ken and Barbie dolls and experiment to find the line of best fit. They collect data, analyze data, and make predictions from it. The learners also use Microsoft Power Point...
Curated OER
Linear and Exponential Models
Students investigate the differences between linear and exponential models. In this linear and exponential models lesson, students make a table of given data. Students determine if the data is linear or exponential by plotting the data...
Curated OER
Solving Polynomial Equations
Young scholars demonstrate how to use spreadsheets as a tool for analyzing, visualizing and solving mathematical problems. Students obtain fundamental grasp of cubic equations and other polynomial equations.


