Teach Engineering
Determining Densities
Don't be dense—use a robust resource. The second installment of a five-part Floaters and Sinkers unit has learners determine the densities of several objects. As part of the activity, they learn the displacement method for finding...
Curated OER
When Will We Ever Use This? Predicting Using Graphs
Here are a set of graphing lessons that have a real-world business focus. Math skills include creating a scatter plot or line graph, fitting a line to a scatter plot, and making predictions. These lessons are aimed at an algebra 1 level...
Curated OER
Graphs
In this graphs learning exercise, learners solve and complete 9 various types of problems. First, they use a large scatter graph to complete a described trend in data. Then, students find the difference of negative numbers and place them...
Flipped Math
Unit 1 Review: Analyze Graphs and Expressions
Get in one last practice. Pupils work through 12 problems and a performance task to review the topics in Unit 1. The problems cover analyzing and modeling with graphs, algebraic properties of equality, and adding, subtracting, and...
Curated OER
Graphing and Analyzing
In this graphing and analyzing worksheet, 9th graders first state if each graph represents a linear or nonlinear relationship. Second, they create a difference table for each set of data presented and determine whether it represents a...
Curated OER
Scatter Diagrams and Curve Fitting
In this Scatter Diagrams and Curve Fitting worksheet, students are guided in how to graph a scatter diagram (plot) and a Best Fit Line using a TI-83 graphing calculator.
Curated OER
Lesson 6-7: Scatter Plots and Equations of Lines
For this scatter plot worksheet, students examine tables and write a linear equation that matches the table. Students graph linear equations. They read scatter plots, determine the trend line, and write a linear equation to match...
Curated OER
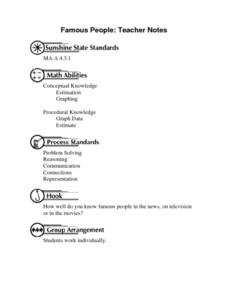
Famous People: Teacher Notes
Young statisticians practice creating scatter plots. First, they estimate the age of 14 people. Next, they write down the estimate in a table labeled x. Then write down their actual age in the table labeled y. Using these x and y...
Curated OER
Scatter Plots
In this scatter plots worksheet, students solve and complete 6 different problems. First, they create a scatter plot to illustrate how weight and height are related and determine their relationship as positive, negative or no relation....
Inside Mathematics
Population
Population density, it is not all that it is plotted to be. Pupils analyze a scatter plot of population versus area for some of the states in the US. The class members respond to eight questions about the graph, specific points and...
Curated OER
Scatter Plots
In this scatter plots worksheet, learners solve and complete 4 different problems. First, they use the table shown to model the relation with a scatter plot and trend line and to predict the value of a variable when given the other...
Curated OER
Aerosol Lesson: Science - Graphing SAGE II Data
Students examine and plot atmospheric data on bar graphs.
Curated OER
Students Analyze Data With Scatter Plots
Scatter plot lessons can help students create different types of graphs by hand or with the aid of technology.
Inside Mathematics
House Prices
Mortgages, payments, and wages correlate with each other. The short assessment presents scatter plots for young mathematicians to interpret. Class members interpret the scatter plots of price versus payment and wage versus payment for...
Curated OER
Investigating Linear Equations Using Graphing Calculator
Students investigate linear equations using the Ti-Calculator. In this algebra lesson, students graph lines and identify the different quadrants on a coordinate plane. They identify ordered pairs used to plot lines.
Curated OER
Scatterplots and Regressions
In this scatterplots and regressions worksheet, students solve 6 different types of problems related to graphing scatterplots and interpreting regressions. First, they create a scatterplot from the given data coordinates and then,...
Curated OER
Lessen the Loan
Middle-schoolers explore the concept linear equations. They use the internet to navigate through videos and problems. Pupils problem solve to determine rates of change, slope, and x and y-intercepts.
Inside Mathematics
Snakes
Get a line on the snakes. The assessment task requires the class to determine the species of unknown snakes based upon collected data. Individuals analyze two scatter plots and determine the most likely species for five additional data...
West Contra Costa Unified School District
Families of Functions Sort
Have some fun with functions with a short activity that asks learners to first sort scatter plot in terms of their correlation. They then sort graphs of different types of functions in terms of key features, such as slope.
Mathematics Vision Project
Module 6: Congruence, Construction, and Proof
Trace the links between a variety of math concepts in this far-reaching unit. Ideas that seem very different on the outset (like the distance formula and rigid transformations) come together in very natural and logical ways. This unit...
Curated OER
Equation of a Line
In this equation of a line worksheet, 9th graders solve and complete 4 different multiple choice problems. First, they use the median fit method to determine the equation that most likely represents the line of best fit for the data...
Curated OER
Statistics
For this statistics worksheet, students view 6 graphs to determine the correlation. Students then answer 4 questions that involve plotting data, determining a relationship, and making predictions.
Curated OER
Properties of Logarithms
Students explore the concept of logarithms. In this logarithms lesson, students graph logarithms on their Ti-Nspire calculator. Students describe the shapes of their graphs by identifying slope, y-intercepts, and roots. Students...
Curated OER
Data Analysis
In this data analysis worksheet, pupils solve and complete 4 different types of problems. First, they reduce the data provided to find the means, and graph the means in a line graph. Then, students graph the data from each mixture shown...


