Curated OER
Slope of a Line
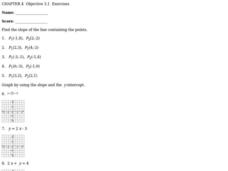
In this slope of a line worksheet, students solve ten problems determining the slope of points and an equation. First, they find the slope of the line containing the two points given in the first five problems. Then, students graph the...
Raytheon
Equations and Graphing Review
In this equations and graphing review instructional activity, learners write, graph and solve equations for 62 problems, including a mid-unit review, with answers included.
Curated OER
Basic Algebra and Computers: Spreadsheets, Charts, and Simple Line Graphs
Students, while in the computer lab, assess how to use Microsoft Excel as a "graphing calculator." They view visual representations of line graphs in a Cartesian plane while incorporating basic skills for using Excel productively.
Curated OER
Integrals
In this integrals worksheet, students solve and complete 22 different types of problems. First, they evaluate each of the listed integrals provided on the sheet. Then, students solve each of the differential equations. They also graph a...
Curated OER
Equations and Inequalities
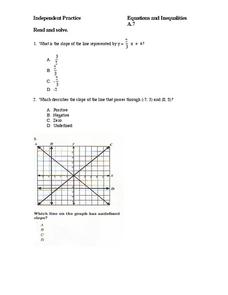
In this equations and inequalities worksheet, 9th graders solve and graph 10 different problems that include determine the slope of a line. First, they determine the slope of a line represented by a given equation. Then, students...
Curated OER
Equations and Inequalities
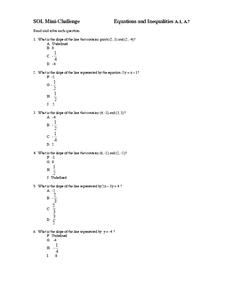
In this equations and inequalities worksheet, 9th graders solve and graph 10 different problems that include determining the slope of a line in each. First, they determine the line that contains given points on a grid. Then, students...
Curated OER
Graphing 3 Ways
In this graphing worksheet, students graph 10 equations using the following methods: slope-intercept form, x- and y-intercepts, or by using a table. Students check their work using a graphing calculator.
Curated OER
Topic 2.2 - Graphing Linear Equations
In this linear equation worksheet, students write 9 linear equations in Standard Form. They then find the x and y-intercept of the graph of each of 6 equations. Finally, students graph 6 equations on the blank graphs provided on the page.
Curated OER
Parabolas
In this parabolas instructional activity, 10th graders solve and graph 10 different problems that include various types of parabolas. First, they determine the vertex and the y-intercept for each problem given the information. Then,...
Curated OER
Graphing Linear Equations
Students graph linear equations. In this algebra lesson plan, students perform transformation on linear equations. They identify the slope and y-intercept of each line.
Curated OER
Linear Equations
Eighth and ninth graders solve and graph 42 different problems that include writing various equations and graphing them on a grid. First, they create a table for each equation and graph it on a grid locating the x-and y-intercepts. Then,...
Radford University
Linear Equations in Real Word Problems
Make up a story about a linear graph. Scholars identify key features of a linear graph, such as intercepts, domain and range, and slope. They then create a word problem that could be represented by the graphed line.
Flipped Math
Quadratics in Standard Form
Get ready to set the standard! Pupils watch a video on how to graph a parabola from a quadratic in standard form without converting the form. Scholars learn how to find the axis of symmetry from the equation and from there the vertex....
Curated OER
Intercept Worksheet
In this algebra worksheet, students graph linear equations by solving for the x and y intercept. They find the x and y intercepts and graph the line. There are 4 questions with an answer key.
Curated OER
The Cartesian Plane
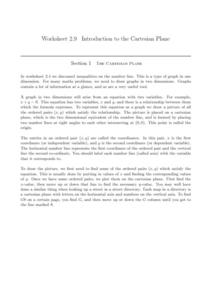
Learners solve and complete 22 various types of problems. First, they find the gradients of the lines and plot the given points. Then, they complete the table of values for each equation and use the table to draw the graph.
Curated OER
Exercise Set 2.4: Equations of Lines
In this linear equations worksheet, students solve 36 linear equations. Students write equations of lines in slope intercept form given a graph, standard form, two points, and slope and a point.
Curated OER
Equations of Graphs
In this equations of graphs worksheet, 9th graders solve and graph 10 different problems that include various types of graphs. First, they determine the equation for each graph shown at the top of the sheet. Then, students determine on...
Curated OER
Graphing Linear Equations Using Data Tables
Students review the Cartesian plane and the process of plotting points. In groups, students create tables, identify the slope and y-intercept, and graph the equation. Afterward, students perform the same process, only, individually. As a...
Curated OER
Chapter 2.4 - Writing Linear Equations
In this slope-intercept worksheet, students solve 18 problems in which they find the slope-intercept and y-intercept of a graph given an equation, find the equation given a point and the slope-intercept, and find the equation of a...
Curated OER
Graph Logarithms
Mathematicians graph logarithmic equations. Teach your students how to identify the intercepts of logarithmic equations and tell whether the function is increasing or decreasing. They find the domain and range of each function.
Ed Migliore
Linear Equations in Two Variables
This traditional textbook style unit includes vocabulary, a direct explanation section, examples, practice problems that directly line up with the explanations and examples, and a unit summary review and practice problems. Learners get...
Curated OER
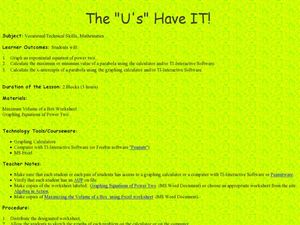
The "U's" Have IT!
Students explore the maximum and minimum values of parabola. In this exponential equations lesson, students use graphing calculators or TI Interactive Software to calculate values of parabola and graph x-intercepts of parabola.
Curated OER
Graphing Inequalities in Two Variables
This study guide is a great resource to help you present the steps to graphing linear inequalities. Show your class two different ways to graph an inequality and work on a real-world example together. The document could also be easily...
Curated OER
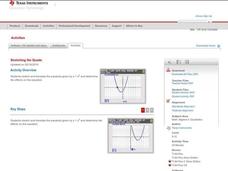
Stretching the Quads
Explore parabolas in this algebra lesson with the graphing calculator. The class investigates what effects the changing of the parameters of the vertex form of a quadrati have to its graph. They find the zeros of a quadratic graphically...
