Curated OER
Slopes of Lines
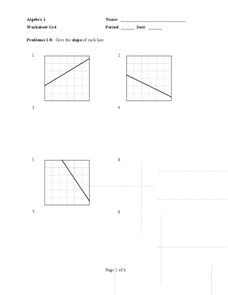
In this slopes of lines learning exercise, 10th graders solve and graph 10 different problems. First, they determine the slope of each line named in the figure and any line parallel to line b and perpendicular to line d. Then, students...
Curated OER
Linear Equations
In this linear equations instructional activity, learners solve 9 different linear equations by applying the point-slope formula in each. First, they determine the linear equation of each. Then, students use the slope and one point of...
Curated OER
Worksheet Gr4: Linear Equations
In this linear equations activity, students solve 24 short answer problems about slope. Students find the slope of a line given a table, graph, two points, and the intercepts.
Curated OER
Quadratic Functions
In this algebra activity, students graph quadratic functions and identify the vertex, axis of symmetry, maximum and minimum and intercepts. There are 7 questions.
Curated OER
Graphing Linear Equations
Ninth graders review the information that they have already learned
with regard to linear equations and graphical representations. They then assist in combining equations with a graphical element and complete various graphs with this...
Curated OER
Graph Logarithms
Mathematicians graph logarithmic equations. Teach your students how to identify the intercepts of logarithmic equations and tell whether the function is increasing or decreasing. They find the domain and range of each function.
Curated OER
Graphs of Functions
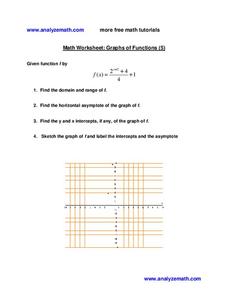
In this algebra worksheet, 11th graders calculate the domain, range, asymptote and intercepts of a quadratic function. They sketch the graph and identify the transformation. There are 4 questions in this worksheet.
Curated OER
Graphing Polynomials
Students graph polynomial equations using different methods. In this algebra lesson, students identify the different ways the x and y values relate in a graph. They solve for x by finding the zero's of the polynomials.
Curated OER
Solving Quadratic Equations
For this quadratic equations worksheet, 9th graders solve and complete 7 different problems that include factoring quadratics. First, they solve for the values of x that make the equation true. Then, students substitute their values into...
Curated OER
Skills Review Sheet: Equations
Learners find the equation that passes through two given points. They then locate the intersection of two lines, and find the x and y intercepts for four parabolas when given their equations. Answers are provided.
Curated OER
Quadrants
In this quadrants worksheet, 10th graders solve and graph 6 different graphs that contain four different quadrants. They name the quadrant or on which axis the point lies. Students identify the difference between graphing positive and...
Illustrative Mathematics
Graphs of Quadratic Functions
Instead of the typical quadratic questioning, explore the function and look at the three different ways a parabola can be written. The main task is when given several clues, young mathematicians must write an equation that matches the...
Mt. San Antonio Collage
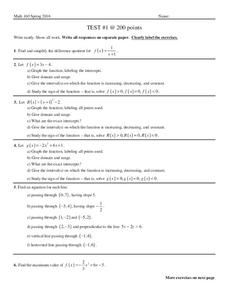
Test 1: Graphing Functions
Graph the night away with all the different types of functions provided in the worksheet. Linear, quadratic, and rational all ask for graphs, domain and range and other key factors about the functions.
Curated OER
Exponential Growth and Decay
Quiz your middle and high schoolers on solving exponential growth and decay. First, they evaluate for a variable given the second variables value. Then, they graph an equation that illustrates the exponential growth or exponential decay...
Willow Tree
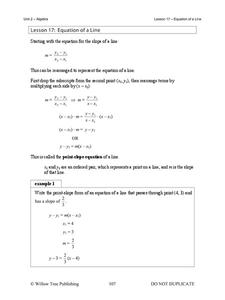
Equations of a Line
Each form of a linear equation has its purpose — pupils just have to find it. Building on the previous lesson in the series, learners examine point-slope and standard form. Using point-slope form, pupils write the equation of a...
Illustrative Mathematics
Proportional Relationships, Lines, and Linear Equations
The resource is a good introduction to what makes a proportional relationship between two lines. Discuss the similarities of both lines and the possibility of intersection. Use this opportunity to list other acceptable forms of each...
Charleston School District
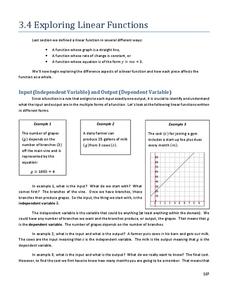
Exploring Linear Functions
What does a graph or equation say about a situation? Lots! The lesson uses the concepts explored in the previous four lessons in the series and applies them to problem solving situations. Learners create an equation from problems posed...
CCSS Math Activities
Smarter Balanced Sample Items: High School Math – Claim 3
Communication is the key. A presentation provides 25 sample items for Claim 3, Communicating Reasoning, for the Smarter Balanced High School Math assessment. Items require pupils to answer the question and provide logical reasoning to...
Curriculum Corner
8th Grade Math "I Can" Statement Posters
Clarify the Common Core standards for your eighth grade mathematicians with this series of classroom displays. By rewriting each standard as an achievable "I can" statement, these posters give students clear goals to work toward...
Curated OER
Worksheet 24
For this math worksheet, students work with three dimensional graphing. The application problems include surface ships on maneuvers determining a submarine's course, helicopter travel, and proving that four points are coplanar. Students...
Curated OER
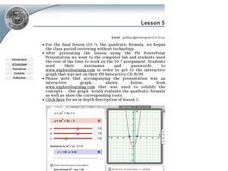
Lesson 5: The Quadratic Formula
Pupils plot quadratic curves to distinguish how different values of a affect a graph. They solve quadratic equations by completing the square. Student's recognize the connection between the roots and the corresponding graph's...
Curated OER
Central and Inscribed Angles
In this central and inscribed angles worksheet, 10th graders identify and solve 20 different problems that include determining inscribed angles and intercepted arcs. First, they determine the measure of point P if the given angles are...
Curated OER
An Exploration of the Slope of a Line
Students define the slope of a line. In this algebra lesson, students differentiate between parallel and perpendicular lines using their slopes. They rewrite equations in slope intercept form and explain the meaning of the slope.
Curated OER
Writing Equations from a Table
Students use coordinates in a table to write equations. In this algebra lesson plan, students discuss rate of change as it relates to slope and x and y values. They plot the points from a table to graph their lines and write an equation...
Other popular searches
- Finding X and Y Intercepts
- Algebra X Intercept
- Graph Using X and Y Intercepts
- Finding the X and Y Intercepts
- X Y Intercepts Graphing
- Parabola X Intercepts
- Y Intercept and X Intercept
- Graph X and Y Intercepts
- X Intercepts Activity
- Graphing X and Y Intercepts
- Y X Intercepts

