Curated OER
Anno's Mysterious Multiplying Jar
Upper graders write word problems and research the uses of multiplication. They start off by taking a pre-test on multiplication and then read the book, Anno's Mysterious Multiplying Jar. They make up word problems to go with their...
Curated OER
Be a Problem Solving Star
Third graders observe a math problem and discuss what it is and what they should do with it. They are introduced to the STAR steps for problem solving and discuss how to use it to answer math problems as well as incorporating some of the...
Curated OER
Apple Logic and Problem Solving
Young scholars examine apple production in the United States. In this interdisciplinary lesson, students use problem solving strategies introduced to solve math problems associated with apple production in the United States. Student...
Yummy Math
US Holiday Candy Sales
Candy is a big business! Calculate the amount of money consumers spent on major holidays—Easter, Halloween, Christmas, Hanukkah, and Valentine's Day—based on the total amount of candy sales from 2011 and the percentage of each holiday's...
New York State Education Department
TASC Transition Curriculum: Workshop 7
Designed specifically for math instructors, the seventh workshop of a 15-part series allows time to explore Webb's DOK, ponder open-ended questions, and create lessons to apply what is learned. Teachers craft high-quality math problems...
Yummy Math
More Chocolate Candy?
Everyone knows that candy is the best part of any holiday—but which holiday's candy gives you the most bang for your buck? Analyze a chocolate heart, a chocolate bat, and a normal piece of chocolate to decide which piece of candy has the...
Ahisma Summer Institute
The Power of One - Math in a Different Angle
In this 2-day lesson focused on exponents, middle schoolers will cross the curriculum by engaging in science, history and language arts activities. Exponential growth will be explored using grains of rice on a chess board. Exponential...
Curated OER
Problem Solvers for Life
Fifth graders identify and explore the components of solving a problem. Students conduct a survey to collect, analyze and interpret data based on a given problem. Also, 5th graders use a variety of strategies to solve math problems,...
Yummy Math
Parametric Equations and a Heart
Trigonometry, art, and Valentine's Day come together in a creative activity about parametric equations. Learners calculate several equations before graphing them either by hand, on a graphic calculator, or Excel spreadsheet to curve...
EngageNY
TASC Transition Curriculum: Workshop 15
What do a cheetah, Audi commercial, and air have in common? They're all topics of an engaging inquiry-based, hands-on workshop for educators about background knowledge, reading strategies, the CER model, and argumentative writing. The...
Curated OER
Twelve Days of Christmas--Prediction, Estimation, Addition, Table and Chart
Scholars explore graphing. They will listen to and sing "The Twelve Days of Christmas" and estimate how many gifts were mentioned in the song. Then complete a data chart representing each gift given in the song. They also construct...
Curated OER
Making Choices
Students solve word problems relating to economic choices. In this economic choices lesson, students discuss the importance of budgeting and how to save money. Students complete a economic choices worksheet.
Curated OER
Money Talks Canadian Money
Learners use newspapers, games and journal writing activities to examine the importance of money and the role it plays in daily life. They complete several math problems, fill out worksheets and practice changing varying amounts.
Curated OER
Circumference of a Pumpkin
Fourth graders watch a video and find the circumference of a pumpkin. In this circumference lesson, 4th graders watch a video to help them find the circumference of their pumpkins. Students define the word circumference on their data...
Curated OER
Tiles, Blocks, Sapphires & Gold: Designing a Treasure Map
Young cartographers in groups hide treasure at school and then create a map to find it using pattern blocks and tiles. They make paintings with clues to create a visual representation of the location of their treasure. Groups present...
Curated OER
Ohio Census 1990 and 2000
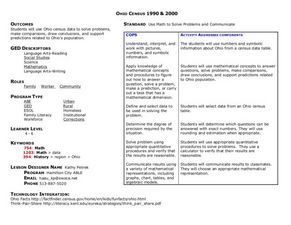
Students begin the lesson plan by examining Census data from the state of Ohio from 1990 and 2000. Using a worksheet, they solve problems using the data and a calculator. They share their responses with the class and discuss what the...
Curated OER
Inventors Unit Survey
Students develop and conduct a survey for their inventors unit. They create a five question survey and tally the survey results, and create a graph using Microsoft Word and Graph Club 2.0.
Curated OER
Equadorian Rainforest: The Tropical Supermarket
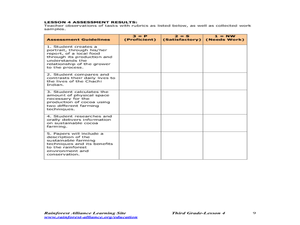
Students study the concept of sustainable agricultural practices through cocoa farming and the lives of the people who are the producers. Students watch a slide show and read a story which helps them understand the origins of chocolate,...
Curated OER
Technobiz
Students examine candy preferences to create a plan in order to improve candy sales. In this technobiz lesson plan, students build spreadsheet and organizational skills by graphing and calculating data. Students are introduced to...
Curated OER
Is the Hudson River Too Salty to Drink?
Students explore reasons for varied salinity in bodies of water. In this geographical inquiry lesson plan, students use a variety of visual and written information including maps, data tables, and graphs, to form a hypothesis as to why...
Curated OER
Transportation Through Time
Third graders measure the speed at which they can walk in order to understand speed and distance traveled. They then research the history of transportation and express data in a class timeline.
Curated OER
"it's All in the Cellar"
Seventh graders examine the process of constructing a site plan map at archaeological sites. They discuss the process of mapping techniques and calculation of percentages, create a plan site map of a cellar at Jamestown, and calculate...
Curated OER
The Gathering and Analysis of Data
Young mathematicians gather data on a topic, graph it in various forms, interpret the information, and write a summary of the data. They present their data and graphs to the class.
EngageNY
TASC Transition Curriculum: Workshop 9
Here's a workshop for teachers that rocks the academic world! Using earthquakes as a medium for instruction, educators learn about crosscutting engineering with science. Fun, hands-on, collaborative exercises encourage participants to...


