BW Walch
Creating Linear Inequalities in One Variable
Just when a young mathematician starts to feel comfortable turning word problems into linear equations, shake things up and throw inequalities in the mix. This excellent, instructive presentation takes the steps for solving an...
Charleston School District
Evaluation of Roots
You mean the square root of five and five don't have the same value? Learners estimate the value of irrational roots. As they practice estimating the value, they increase their understanding of roots. The lesson is the fourth in a series...
Curated OER
The Three M's of Statistics: Mode, Median, Mean
Young mathematicians use the Visual Thesaurus to define mean, median, and mode. In this mean, median and mode lesson, learners use online sources to find the definitions of mean, median, and mode before applying the concepts to a class...
EngageNY
Creating and Solving Quadratic Equations in One Variable
Give your classes practice at modeling using quadratic models with a resource that uses area and integer problems to allow individuals to create second degree polynomials. Young mathematicians solve equations using factoring and then...
BW Walch
Solving Linear Inequalities in Two Variables
Although graphing a linear inequality on the plane is but a few steps added onto the graphing of a linear equation, for many learners the logical leap is quite intimidating. This approachable PowerPoint presentation breaks graphing...
EngageNY
Margin of Error When Estimating a Population Mean (part 1)
We know that sample data varies — it's time to quantify that variability! After calculating a sample mean, pupils calculate the margin of error. They repeat the process with a greater number of sample means and compare the results.
BW Walch
Creating Linear Equations in One Variable
The example of two travelers meeting somewhere along the road has been a stereotypical joke about algebra as long as algebra has existed. Here in this detailed presentation, this old trope gets a careful and approachable treatment....
Statistics Education Web
Types of Average Sampling: "Household Words" to Dwell On
Show your classes how different means can represent the same data. Individuals collect household size data and calculate the mean. Pupils learn how handling of the data influences the value of the mean.
EngageNY
Sampling Variability in the Sample Proportion (part 1)
Increase your sample and increase your accuracy! Scholars complete an activity that compares sample size to variability in results. Learners realize that the greater the sample size, the smaller the range in the distribution of sample...
New York State Education Department
TASC Transition Curriculum: Workshop 4
Why is it important to use precise language? Participants explore this question in the fourth activity in a series of 15 on effective instruction. Perfect for all content areas, the activity promotes appropriate language choice through...
Curated OER
Inside OKCupid: The Math of Online Dating
Capture the hearts of your young statisticians with this real-life example of using statistics in online dating. The use of average and geometric mean are discussed in the context of creating the algorithm used to connect people.
EngageNY
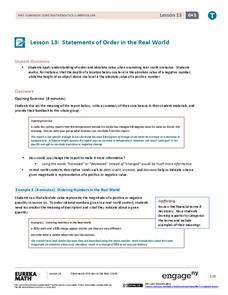
Statements of Order in the Real World
Positive and negative numbers are all around us. Groups read short story contexts and identify a rational number that represents the values in the context. They order the rational numbers and interpret statements of inequality.
Illustrative Mathematics
How Many Containers in One Cup / Cups in One Container?
The object is to model fraction division by asking “How many are in one group?” It is a difficult concept to understand, but developing the model that shows one cup to a certain amount of container or one container to a certain amount of...
EngageNY
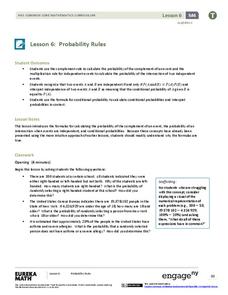
Probability Rules (part 1)
In statistics, probability rules—literally! Learners use their previous knowledge and explore a set of rules for conditional probability, independent probability, and complements. Given different scenarios, they must determine what type...
EngageNY
Operations with Numbers in Scientific Notation
Demonstrate the use of scientific notation within word problems. The lesson presents problems with large numbers best represented with scientific notation. Pupils use these numbers to solve the problems in the 11th installment in a...
EngageNY
Sampling Variability
Work it out — find the average time clients spend at a gym. Pupils use a table of random digits to collect a sample of times fitness buffs are working out. The scholars use their random sample to calculate an estimate of the mean of the...
Curated OER
Introduce Vocabulary: Kindergarten Count to 100
During read-aloud of Kindergarten Count to 100 by Jacqueline Rogers, children listen for context clues about vocabulary that includes the words "first," "second," and "third." I love the way vocabulary development skills are integrated...
EngageNY
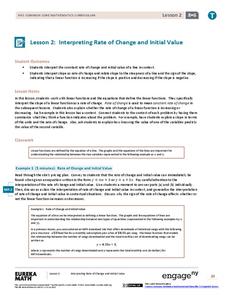
Interpreting Rate of Change and Initial Value
Building on knowledge from the previous lesson, the second lesson in this unit teaches scholars to identify and interpret rate of change and initial value of a linear function in context. They investigate how slope expresses the...
Illustrative Mathematics
Placing a Fire Hydrant
Triangle centers and the segments that create them easily become an exercise in memorization, without the help of engaging applications like this instructional activity. Here the class investigates the measure of center that is...
Noyce Foundation
Apple Farm Field Trip
Monitor the growth of young mathematicians with a comprehensive addition and subtraction assessment. Using the context of a class field trip to an apple orchard, this series of four story problems allows children to demonstrate their...
Curated OER
Define Geometry Terms
The Common Core is intended to help all children meet high academic standards. Here is a Common Core designed lesson that is intended for learners with communication or language difficulties. The lesson is written in a narrative style...
Illustrative Mathematics
How Many Marbles?
Don't lose your marbles! This simple story problem helps make teaching division with fractions much easier. Work on this problem along with the lesson titled, How Many Servings of Oatmeal? to highlight the difference between...
Noyce Foundation
Time to Get Clean
It's assessment time! Determine your young mathematicians' understanding of elapsed time with this brief, five-question quiz.
EngageNY
Events and Venn Diagrams
Time for statistics and learning to overlap! Learners examine Venn Diagrams as a means to organize data. They then use the diagrams to calculate simple and compound probabilities.
