Novelinks
Tuck Everlasting: Similes, Metaphors, and Personification in Imagery
Poetic language is abundant in Natalie Babbitt's beautiful novel, Tuck Everlasting. Learners note the examples of similes, metaphors, and personification they find as they read, and illustrate how the language creates a sensory...
Computer Science Unplugged
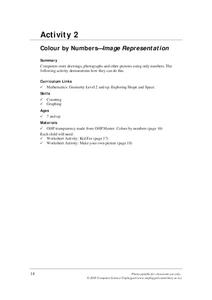
Colour by Numbers–Image Representation
How do computers store and send images? Here's an activity that explains one way a computer can compress image information. Pupils decode run-length coding to produce a black and white image. Pairs then work together to code and...
Fluence Learning
Writing Informational Text: Lemonade Stand
Use a performance task to assess third graders' ability to read informational text. After they plan a lemonade stand business, young entrepreneurs implement that plan through informational writing. The task assumes learners can...
Fluence Learning
Divide Shapes
Let's partition rectangles into equal parts. Assess learners on their ability to divide shapes into equal parts, and their ability to explain their thinking.
Curated OER
A Good Scientist Can . . .
In this scientist worksheet, students use a decoding system to determine the characteristics of a good scientist. Students decode 16 terms.
Curated OER
Which Vegetable Do You Like To Eat the Most?-- Class Bar Graph
In this math activity, students participate in a group graphing activity. Students are surveyed on favorite vegetables and the results are plotted on a bar graph.
Curated OER
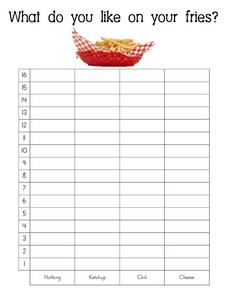
What Do You Like on Your Fries?-- Class Bar Graph
In this math worksheet, students participate in a group graphing activity. Students are surveyed about what they like on their fries: nothing, ketchup, chili or cheese. Results are plotted on a bar graph.
Curated OER
Exploring the Dark Heart of an Obsessive Mind
Students complete a unit of activities for "The Tell-Tale Heart" by Edgar Allan Poe in part to analyze short stories, playwriting, and video production. In this Edgar Allan Poe lesson, students complete a 37 page packet of...
Curated OER
Rhythmic Movement Skills
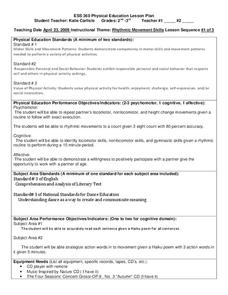
Young scholars explore rhythmic movements. In this performing arts lesson, students create their own movements and then repeat the each others movement. Finally, young scholars create movements to the Haiku generated by the entire class.
Curated OER
Using Ratios to Taste the Rainbow
Students solve problems using ratios and proportion. In this algebra lesson, students analyze skittles and their different colors as they apply the properties of ratios and proportions to solve their problems.
Curated OER
A Picture Is Worth A Thousand Words
Young scholars complete a population pyramid for a city they are studying. They may complete a population pyramid for their city and another one for the country in which the city is located. They compare and contrast the results of the...
Curated OER
Statistics
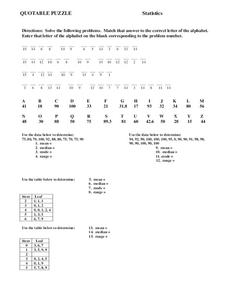
In this statistics worksheet, 8th graders solve and complete 15 different problems. First, they solve each problem by using the data given to determine the mean, median, mode, and range for each set. Then, students match that answer to...
Curated OER
Color Me Hot
Seventh graders use the scientific method, to observe, record and analyze the data they gathered. They make observations using their five senses. Students compare, contrast and draw conclusions based on the observations and data...
Curated OER
Polynomial Functions
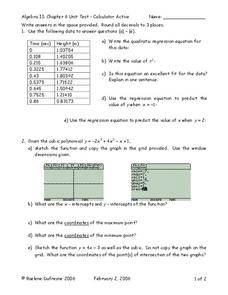
In this Algebra II worksheet, 11th graders use a graphing calculator to determine the regression equation of the given data, graph polynomial functions, factor polynomials, and determine the quotient and remainder in polynomial division....
Curated OER
Introduction to the Scientific Method
Pupils designs and conduct a scientific experiment that identifies the problem, distinguishes manipulated, responding and controlled variables, collects, analyzes and communicates data, and makes valid inferences and conclusions.
Curated OER
Stem-and-Leaf Plots
Seventh graders study steam-and-leaf plots. Given specific data, they create a stem-and-leaf plot . Students identify the mean, mode, range and median. Afterward, they review vocabulary words.
Curated OER
My Test Book: Mean, Median, and Mode
In this math skills worksheet, students solve 10 multiple choice math problems regarding mean, median, and mode. Students may view the correct answers.
Curated OER
Teen Pregnancy: Investigating Cubic Functions
In this teen pregnancy learning exercise, students use a scatter plot and cubic functions to solve word problems about teen pregnancy. Students complete 7 problems.
Curated OER
Bubbles
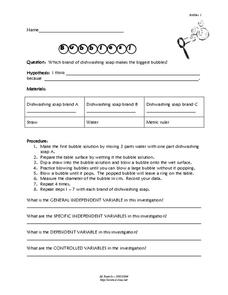
Students experiment bubbles. In this scientific method lesson plan, students identify variables used in proper experiment design. Students conduct experiments with different brands of dish-washing detergent to determine which brand makes...
Curated OER
Statistics
In this statistics worksheet, 9th graders solve and complete 5 different word problems that include different data. First, they determine if there is an explanatory and a response variable in the given data set. Then, students create a...
Curated OER
Concentration and Reaction Rates
Students investigate how varying the concentrations, volumes, and other factors affects reaction rates. Students design and conduct investigations to obtain data used to create graphs of an uncatalyzed reaction vs. a catalyzed reaction....
Curated OER
Fruit Loops/Cheerios Activity: Measures of Central Tendency
In this measures of central tendency learning exercise, students use Fruit Loops and Cheerios to gather statistical data. They find the mean, mode and median of the data. Students construct a box-and-whisker plot of the class data. ...
Curated OER
The Greenhouse Effect
Seventh graders investigate the temperature change in open and closed containers. In this earth science lesson, 7th graders relate this lab activity to greenhouse effect. They create a line graph from data collected in the experiment.
Curated OER
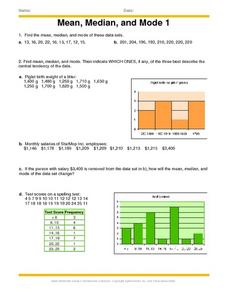
Mean, Median And Mode 1
For this mean, median and mode worksheet, students problem solve and calculate the answers to ten word problems associated with the mean, median and mode of collected data.

