Texas State Energy Conservation Office
Investigation: Blowing in the Wind
Using a simulated air sample, environmental or earth science pupils examine the components. You will need to prepare the faux air by using a hole punch and various colors of construction paper. Each color will represent a different...
Curated OER
The Air Up There
Students engage in a lesson that is concerned with the average daily weather patterns. They collect data over a five day period and then write a summary of the observations made from it. Students record the mean and graph it on a simple...
Curated OER
Dimming the Sun
Students collect, interpret and analyze weather variable data. They describe atmospheric variables that affect evaporation. Students create graphs and analyze the information collected.
Curated OER
What's Going to Happen at Any Given Barometer Reading?
Fourth graders brainstorm a list of words associated with weather. In groups, they sort the words into categories and observe the weather in their area for a month. To end the lesson, they compare the barometer measurements for a...
Curated OER
Analysis of Atmospheric Conditions for a High Mountain Retreat
Students examine the relationship between altitude, atmospheric pressure, temperature and humidity at a particular location. They practice science and math in real world applications. They write reports detailing their scientific...
Curated OER
Global Warming Statistics
Students research real-time and historic temperature data of U.S. and world locations, and analyze the data using mean, median, and mode averages. They graph the data and draw conclusions by analyzing the data. A spreadsheet is used to...
Curated OER
Climographs
Learners identify trends and characteristics of climate zones and specific places within. Then, they graph annual climate trends (primarily Temperature and Precipitation) and create, interpret and extrapolate information based on...
Curated OER
Scientist Tracking Network
Students correlate surface radiation with mean surface temperature of several geographic regions. They observe how these parameters change with latitude and construct an understanding of the relationship of solar radiation to seasonal...
Curated OER
El Nino
Students explain what El Nino is, where it is located and how it is created. They describe the weather changes caused by El Nino. They draw the patterns of El Nino on a world map. They predict economic effects El Nino has on the areas it...
Curated OER
Does Global Warming Increase the Intensity of Atmospheric Natural Disasters?
Students study global warming by communicating the problem, process and solutions. In this global lesson plan students use graphs, research and write a critical stance on natural disasters.
Curated OER
Rain On
Fourth graders study the water cycle and clouds. In this water cycle and cloud lesson, 4th graders determine the definition of condensation and watch a demonstration in which the teacher makes a cloud in a bottle. They discuss the water...
Curated OER
Tech Algebra: A Statistics Study
Students use the internet to gather a minimum of thirty pieces of data. Students create box and whisker graphs, and stem and leaf plots from the information. They calculate mean, median, mode, and range. Students write a summary and...
Curated OER
Farming: Natural Resources (Lesson 2)
Students identify the types of natural resources. They explain the difference between weather and climate. They practice using a rain gauge and reading a thermometer.
Curated OER
Tracking Weather Over Time
Young scholars gather, analyze and interpret data. They explain scientific inquiry. They plot points on a map and report information from a spatial perspective.
Curated OER
Investigating Median, Mode, and Mean
Students develop strategies to organize data while following teacher demonstration. They calculate the mean, median and mode of a data set while determining the relationships between the numbers. They analyze data from tables and double...
Curated OER
Evaporation
First graders explore, analyze, document and study weather and the water cycle. They observe the weather and begin a weather journal. Each student interacts with the concepts of evaporation, condensation and precipitation, clouds,...
Curated OER
Give Me Back My School: A Back to Basics Approach to Ecological Restoration
Ninth graders research local geography to create successful, ecological school landscaping. They determine soil type, average weather patterns and temperature graphs and use the information to select ideal plants and plant maintenance...
Curated OER
Eyewitnesses to Change
Students explore recent changes in the Artic's climate that have been observed by Artic residents. They watch videos, take notes and create a concept map. They also look at historical weather data from a specific Artic community. The...
Curated OER
Keep It Cool
Students complete a science experiment to study insulation, heat transfer, and permafrost. For this permafrost study lesson, students design and test a soda insulator. Students graph their class data and discuss the results. Students...
Curated OER
Observing Fall Migrants
Pupils observe the migration of monarch butterflies. They collect data regarding the number of monarchs they see, the location, the butterflies' behavior, the temperature and the date and time. Then they send their data to a university...
Curated OER
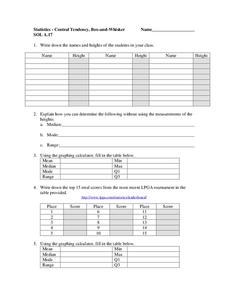
Central Tendency
In this central tendency worksheet, students solve and complete 10 different problems that include measures of central tendency. First, they write down the names and heights of students in their class. Then, students explain how they can...
Curated OER
Relative Humidity of Your School
Students predict the location where the relative humidity the highest and lowest in and around their school. They use a sling psychrometer to measure the relative humidity of the various locations.
Curated OER
Farming: Raising Winter Wheat (Lesson 3)
Students identify foods that are made from wheat. They use a line graph to explain measurement. They identify foods from the food groups and explain how temperature, prefcipitation and natural resources affect the growth of wheat.
Curated OER
Tracking Ozone
Pupils track an ozone event in Groton, CT. They compare weather changes and the subsequent ozone levels. Also, they make comparisons and determinations about ozone levels.


