Curated OER
CSI Clamshell Investigation
Pupils explore and explain how moon snails eat and where the holes in clamshells come from and then draw conclusion from the data collected. They incorporate math and graphing skills to determine if there is a relationship to a clam's...
Curated OER
White-tailed Deer Issues
Ninth graders examine the white tail deer population in Pennsylvania and explore the impacts that the deer have on the flora and fauna. In this white-tail deer instructional activity students complete an activity and graph their...
Curated OER
Morning Activity
First graders show appropriate ASL hand signs to answer questions for the morning meeting. They show the day of the week, the weather, and mode of transportation to school using signs. They copy the sign of the day and use name cards to...
Curated OER
Impact Craters
Young scholars investigate the factors affecting the size of a crater. In this space science instructional activity, students collect data from the activity and graph them. They explain how velocity of impact relate to crater size.
Curated OER
Hudson River Salt Front Activity
In this Hudson River worksheet, students read a passage about the Hudson and salinity, they complete graph interpretation and questions and activities.
Curated OER
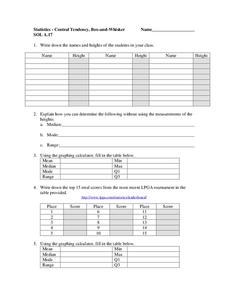
Central Tendency
In this central tendency worksheet, students solve and complete 10 different problems that include measures of central tendency. First, they write down the names and heights of students in their class. Then, students explain how they can...
Curated OER
Tsunami Simulation Experiment
Students examine the importance of tsunami warning systems. They read and discuss an article, conduct an experiment in a wave tank, calculate wave velocities of tsunamis, and identify what happens to tsunamis as they approach a shoreline.
Curated OER
Scatter Plots
Seventh graders investigate how to make and set up a scatter plot. In this statistics lesson, 7th graders collect data and plot it. They analyze their data and discuss their results.
PHET
Under Pressure
Do you work better under pressure? Pupils explore pressure when altering fluid density, gravity, container shape, and volume. Units can be converted to kPa, atm, and psi. To finish, scholars describe pressure as a function of depth,...
Curated OER
Cloud Watchers
Second graders read "The Cloud Book" by Tomie dePaola to jumpstart their cloud study. They offer examples of liquids, solids, and gases and chart them. They observe the making of a cloud in a demonstration. They discuss and draw...
Curated OER
Temperature in The Atmosphere
In this science worksheet, middle schoolers find the answers to the five questions and they fill in the graphic organizer for the temperatures found in different heights of the atmosphere.
Curated OER
School Temperatures
Students collect and record temperatures throughout the school. Using this information they compare and contrast the temperatures recorded from various spots throughout the school.
Curated OER
Hurricanes
Eighth graders gather information on hurricanes that are affecting the world at the time of the lesson. They work together in groups to collect the data and record their information in a table. They are asked questions to finish the lesson.
Curated OER
Relative Humidity of Your School
Students predict the location where the relative humidity the highest and lowest in and around their school. They use a sling psychrometer to measure the relative humidity of the various locations.
Curated OER
Cloud Types
Students examine cloud types. In this cloud lesson plan, students identify cloud types, observe clouds and collect data, and analyze data to identify the most common cloud they observe overhead during the course of a month.
Curated OER
Sky Watching
Young scholars trace how weather patterns generally move from west to east in the United States.
Curated OER
Tracking Ozone
Pupils track an ozone event in Groton, CT. They compare weather changes and the subsequent ozone levels. Also, they make comparisons and determinations about ozone levels.
Curated OER
Physical Characteristics of the Troposphere
Students examine troposphere graphs and mcompare their hypotheses with data collected by weather balloons launched from the NOAA ship, Ronald H. Brown. they write summaries about the physical properties of the troposphere.
Curated OER
Changes Close To Home
Learners interview the senior citizens in their community. While interviewing them, they identify perceptions they have about the local climate. Using the internet, the compare the results of the interview to those of public thirty...
Curated OER
Clues to Climate Change
Eighth graders study topics related to global weather patterns and their local effects. They hone their research and presentation skills using online resources content specific tools, and graphing data. They create simple PowerPoint...
Curated OER
Physical Characteristics of the Troposphere
Pupils lexplore environmental trends in the troposphere- temperature, dew point, pressure and wind speed- by checking their hypotheses against data collected by weather balloons.
Curated OER
Temperature Comparisons
Students practice plotting temperature data points on a line graph in groups and examine the temperature differences at the same time of year. They graph the temperatures in Lannon, WI, and Mitchell's Plain, SA. After the data has been...
Curated OER
A Comparison of Land and Water Temperature
Students use the NASA website's Live Access Server to create a graph of surface temperature at two locations on earth. They analyze the data and then answer specific questions provided in this lesson. They also examine and compare the...
Curated OER
Power In The Wind
Students experiment designing graphs of selected readings from the Nebraska sites from the Power in the Wind study. They choose whether or not to put their data in a spreadsheet program to make a computer-generated graph or to complete...
Other popular searches
- Kindergarten Weather Graph
- Fall Weather Graph
- Daily Weather Graph
- Culture Weather Graph
- Graph Weather Chart
- Graphing Weather
- Graph Weather
- Graphing Weather Data
- Graphing Weather Activity
- Graphing the Weather
- Weather Graphs and Charts
- Weather Graph Template


