Curated OER
Using Non-Text Features
Second graders examine graphs and charts from their local newspaper. As a class, they discuss what the data means and how it relates to the article. In groups, they are shown two sets of graphs or charts and they practice explaining...
Curated OER
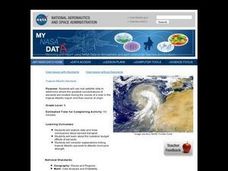
Troical Atlantic Aerosols
Young scholars explore the effect aerosols have upon he weather and climate. They observe NASA satellite images to explore and draw conclusions about aerosol transport. From studying the images, students track the path of aerosols. They...
Curated OER
Give Me Back My School: A Back to Basics Approach to Ecological Restoration
Ninth graders research local geography to create successful, ecological school landscaping. They determine soil type, average weather patterns and temperature graphs and use the information to select ideal plants and plant maintenance...
Curated OER
How Wet Did It Get?
Students measure the rainfall/snowfall on the playground on a rainy/snowy day with a rain/snow gauge. They draw a bar graph representing the amount of water that fell and observe a satellite image of the clouds and local weather system...
Curated OER
Lake Ice Out Lessons
Students explore the greenhouse effect. For this environment lesson, students describe how "ice out" affects animals and plants who live in a Maine lake. Students graph "ice out" data and make predictions about the upcoming...
Curated OER
Believe It...Or Not
Students critically analyze data regarding climate changes using a glossary of terms generated by examination of climate related articles. They examine and graph climatic data, and discuss, hypothesize and test apparent discrepancies in...
Curated OER
Science: When Autumn Leaves Fall
Students conduct Internet research to discover the reason why leaves change color in autumn. On a nature walk around school grounds, they collect leaves of various colors and shapes over a three-week period. finally, students select...
Curated OER
Keep It Cool
Students complete a science experiment to study insulation, heat transfer, and permafrost. For this permafrost study lesson, students design and test a soda insulator. Students graph their class data and discuss the results. Students...
Curated OER
Glossary, Index, and Table of Contents
Fourth graders use two separate sources to learn about index, glossary, and table of contents usage. In this library lesson, 4th graders use two books, Learning About Weather with Graphic Organizers, and The World Almanac for Kids, to...
Curated OER
Seasonal Cloud Cover Variations
Young scholars recognize different cloud types. They determine the seaonality of various types of clouds. They graph the data and determine if a correlation exists between season, cloud cover and type of clouds most prevalent during each...
Curated OER
Tides
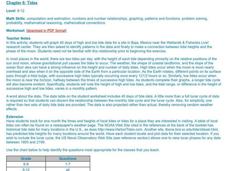
Students graph 40 days of high and low tide data for a site in Baja, Mexico near the Wetlands & Fisheries Live! research center. They identify patterns in the data and finally to make a connection between tidal heights and the phase...
Curated OER
Atlantic Canada Report
Ninth graders create a report that will show an in-depth knowledge of the various geographical and climatic features of Atlantic Canada. They produce various items, on paper and using the computer, to demonstrate knowledge of outcomes,...
Curated OER
Trouble in the Troposphere
Students Use data sets from MY NASA DATA to produce graphs comparing monthly and yearly ozone averages of several U.S. cities. They analyze and evaluate the data and predict trends based on the data. In addition, they discuss and...
Curated OER
Color Enhanced Maps
Students download or create maps with numerical weather data. They add isolines and color to create regions on their maps. They explore the visual properties of color palettes and create a visualization applying their knowledge.
Curated OER
Rate It - Working With Positive and negative Numbers
Learners practice rating things using numbers between -2 to 2. In this rating lesson, students determine what a rating scale is before rating things such as the weather, a book, or a day using the numbers -2 to 2. They examine the use of...
Curated OER
Valley Forge
Students describe how location, weather, and physical environment affect the way people live, including the effects on their food, clothing, shelter, transportation, and recreation. They also describe the lives of American heroes who...
Curated OER
Trouble in the Troposphere
Students create graphs using NASA data, compare ozone levels of several U.S. cities, analyze and evaluate the data and predict trends based on the data, and discuss and describe how human activities have modified Earth's air quality.
Curated OER
At Home On The Range
Students explore the history and domestication of the Bovidae family and their importance to our prairie ecosystem. Using a map of the United States, students located the American Great Plains. They complete worksheets and discuss...
Curated OER
Celebrating the Solstice and Equinox
Fourth graders graph the number of daylight hors throughout the year and examine why day length varies. They discover that seasonal changes and latitude on Earth affect the number of hours of daylight in each day. Students listen to...
Curated OER
Sunlight & Soil
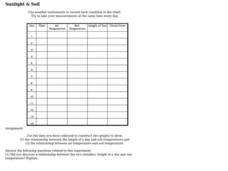
In this earth science worksheet on sunlight and soil, students use data collected in a chart to construct two graphs. Following, they answer five questions as they relate to the experiment performed.
Curated OER
Mapping a Temperature Field
Students measure and graph temperatures. In this temperature field lesson students use a map to measure and plot field values and construct isolines and interpret the results.
Curated OER
Using the Very, Very Simple Climate Model in the Classroom
Students study the relationship between the average global temperature and carbon dioxide emissions. In this weather lesson students develop a test scenario using a model then read and interpret graphs of data.
Curated OER
Paper Airplanes
Students study paper airplanes. In this lesson on aerodynamics, students print out the folding directions for making paper airplanes and after making the planes test their paper airplanes to see how well each flies. Students weigh...
Curated OER
At Home on the Range
Students discuss the American bison. In this social studies lesson plan, students discuss the history of the American bison and graph the decline of the bison population.
Other popular searches
- Kindergarten Weather Graph
- Fall Weather Graph
- Daily Weather Graph
- Culture Weather Graph
- Graph Weather Chart
- Graphing Weather
- Graph Weather
- Graphing Weather Data
- Graphing Weather Activity
- Graphing the Weather
- Weather Graphs and Charts
- Weather Graph Template

