Hi, what do you want to do?
Teach Engineering
Where Are the Plastics Near Me? (Mapping the Data)
The last activity in a nine-part series has teams create a Google Earth map using the data they collected during a field trip. Using the map, groups analyze the results and make adjustments to the map to reflect their analysis. A short...
Willow Tree
Scatterplots and Stem-and-Leaf Plots
Is there a correlation between the number of cats you own and your age? Use a scatter plot to analyze these correlation questions. Learners plot data and look for positive, negative, or no correlation, then create stem-and-leaf plots to...
Willow Tree
Line Graphs
Some data just doesn't follow a straight path. Learners use line graphs to represent data that changes over time. They use the graphs to analyze the data and make conclusions.
Laboratory for Atmospheric and Space Physics
The Planets and Scale
Scholars gain an insight into the relative size of planets and distance between inner and outer planets with the help of informational text, a data table, and a series of four questions.
Willow Tree
Box-and-Whisker Plots
Whiskers are not just for cats! Pupils create box-and-whisker plots from given data sets. They analyze the data using the graphs as their guide.
Granite School District
Kindergarten CCSS Math Vocabulary Word List
Help kindergartners develop the academic language they need to master the Common Core standards with this list of math vocabulary. Including the definitions of each term as well as a set of word cards with supporting images and examples,...
Multiverse
Rainbows of Light: The Visible Light Spectrum
Rainbows can teach us about the visible light spectrum. Learners observe multiple items that clearly display a rainbow to develop better connections. The lesson then explains wavelength using a rope to make waves.
T. Smith Publishing
Computer Basics for Kids Worksheet
This informational reading instructional activity can be used in your literacy or computer class. Students learn the basic components of computers then test their knowledge with multiple choice and fill-in-the-blank questions.
Khan Academy
Khan Academy: Picture Graphs (Pictographs) Review
Picture graphs are a fun way to display data. This article reviews how to create and read picture graphs (also called pictographs).
Math Is Fun
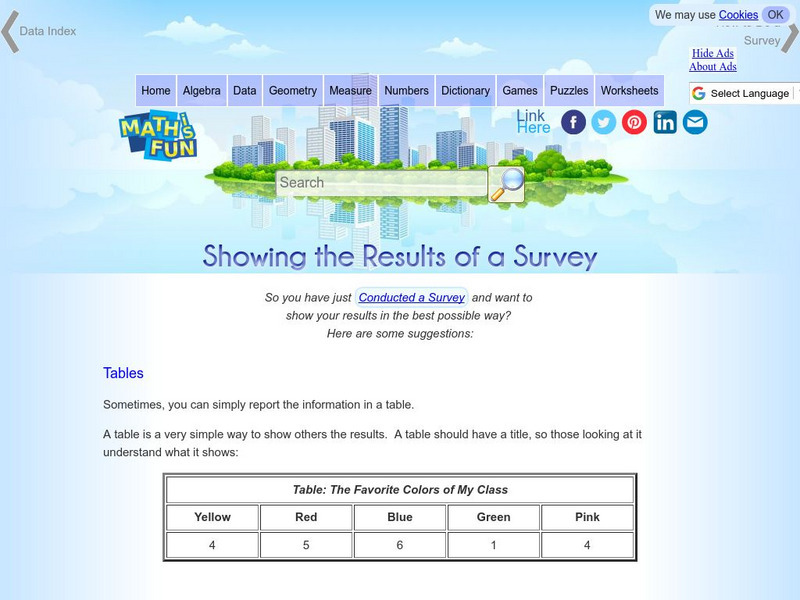
Math Is Fun: Showing the Results of a Survey
A variety of ways to display the results of a survey are listed, including tables, statistics and different types of graphs.


