Curated OER
Using Bar Graphs to Understand Voting Patterns
Bar graphs are used as a way to study voting patterns in the United States. A variety of statistical data is presented in the graphs, and pupils must interpret the data in order to make a report to the class. Three excellent graphs,...
College Board
Civic Knowledge and Action: Voter Registration
What does the data say? Using provided voter data from the 2016 presidential election, scholars describe the data and identify questions they could answer by analyzing it. Learners then construct tables and use them to determine whether...
Curated OER
Practice: Word Problems
Congratulations, you've just hit the word problem jackpot! Covering an incredible range of topics from integers and fractions, to percents, geometry, and much more, this collection of worksheets will keep young mathematicians busy...
Curated OER
Use a Table: Problem Solving
In this math tables worksheet, students read the math word problem and use the information from the math table with the votes for the club trip. Students then complete the problem solving method for the table for understand, plan, solve,...
Curated OER
Election Results Map
Students use election night returns to create a map of the results. They can represent popular vote results or electoral votes received. They use the internet to gather information about the electoral college and results.
Curated OER
Organize Data
In this organizing data worksheet, students complete the tally chart for 'Votes for Team Mascot' and then use the chart to answer the six questions.
Curated OER
Free Printables: Place Value
In this place value worksheet, students cut out the 10 arrows on the page, each of which contains a number between 0 and 9 and then three 0s after that number. The students then insert a decimal in the right spot to make the correct...
Curated OER
Stocks
Explore stocks! This straightforward slide presentation covers all the terminology associated with the stock market. Stocks, shareholder, stock market, IPO, stock exchange, NYSE, AMEX, NASDAQ, securities and exchange commission,...
Curated OER
Bar Graphs
Students perform operations and graph their data using charts and bar graphs. For this algebra lesson, students follow specific steps to make a bar graph. They create a survey about people favorite things and plot their data from the...
Noyce Foundation
Truffles
Knowing how to scale a recipe is an important skill. Young mathematicians determine the amount of ingredients they need to make a certain number of truffles when given a recipe. They determine a relationship between ingredients given a...
Beacon Learning Center
Bowling Over the Order of Operations
Upper graders will solve equations using order of operations, and create equations that to play a fun math bowling game. They will bowl using dice to practice operations. Extensions are also included.
Curated OER
Show Me The Data!
Pupils create a bar graph. They will collect and organize data to turn into bar graphs. They create graphs for the favorite sports of the class, color of M&M's, and types of cars passing by.
Willow Tree
Bar Graphs
Circles, lines, dots, boxes: graphs come in all shapes in sizes. Scholars learn how to make a bar graph using univariate data. They also analyze data using those bar graphs.
Bowland
Highway Link Design
Discover a renewed appreciation for the highway transportation department. with a lesson that has scholars design a highway route that meets certain conditions, including traffic flow, curves, speed limits, financial costs, and...
Curated OER
District Decisions
Learners review census data and examine the manner in which reapportionment and redistricting occurs. They, in groups, debate a proposed change in the way congressional districts are drawn and present their debates to the class.
Curated OER
Counting On Freedom
Young scholars examine the poem and artistic masterpiece The Quadroon Girl and use this knowledge to practice mathematical concepts such as: more than, less than, counting, and majority.
Curated OER
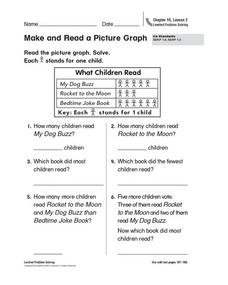
Make and Read a Picture Graph
What books do you like? Have your learners read and interpret a picture graph detailing a fictional class's favorite books. Consider conducting a survey of your learners' favorite books and plotting the results as a class!
Houghton Mifflin Harcourt
Add and Subtract Fractions with Unlike Denominators
Once your math class has mastered the skill of adding and subtracting fractions with uncommon denominators, let them apply it to real-life problems. Six scenarios are presented for them to solve, all involving pizza! A tasty test for...
Curated OER
Is London Bridge Really Going to Fall Down?
Students discover what forces work together to hold up a suspension bridge. They see various bridges around the world, and learn the basic principles that enable each bridge to support itself. Groups design their own bridge, testing how...
Curated OER
Matrices
In this Algebra II worksheet, 11th graders solve problems that involve matrix representation, matrix operations, solving systems with inverse matrices, row reduction, and systems of inequalities. The six page worksheet contains twenty...
Curated OER
Problem-Solving Application: Use Circle Graphs
In this problem-solving worksheet, 5th graders problem-solve 2 mathematical equations involving 4 key steps and 2 circle graphs.
Curated OER
Make a Circle Graph
In this making circle graphs practice worksheet, students sharpen their problem solving skills as they solve 6 story problems.
Curated OER
Proportion and Percent
In this worksheet on proportion and percent, students review the concepts, then find the percentage for proportions in 10 word problems.
Curated OER
Compare and Order Fractions, Decimals and Percents
In this compare and order worksheet, students solve 6 word problems; all problems are related to comparing and ordering fractions, decimals and percents.
Other popular searches
- Voting Rights Movement
- Voting Rights Act
- 1965 Voting Rights
- Minority Rights and Voting
- America and Voting Rights
- America Voting Rights
- Voting Rights Act 1965
- Voting Rights History
- Voting Rights Act of 1965
- Expanding Voting Rights
- Voting Rights of Women
- History of Voting Rights


