EngageNY
Margin of Error When Estimating a Population Mean (part 1)
We know that sample data varies — it's time to quantify that variability! After calculating a sample mean, pupils calculate the margin of error. They repeat the process with a greater number of sample means and compare the results.
Curated OER
Incorporating 3D Visualizations into Your Classroom
Students make observations through 3-D visualizations. They explore scientific and geologic processes through the use of 3-D pictures.
American Statistical Association
EllipSeeIt: Visualizing Strength and Direction of Correlation
Seeing is believing. Given several bivariate data sets, learners make scatter plots using the online SeeIt program to visualize the correlation. To get a more complete picture of the topic, they research their own data set and perform an...
Curated OER
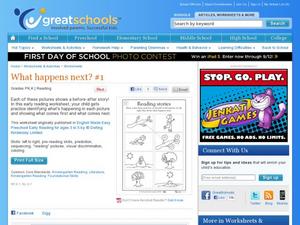
What Happens Next? 1
Knowing how to sequence events means you have to know what happens before and after. Little ones draw a line from four before images to the images that show what happened next. This is a good challenge for your youngest learners.
Curated OER
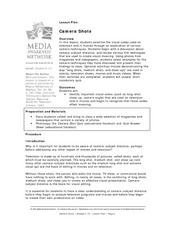
Camera Shots
Understanding how visual codes such as long-shots, close-ups, and camera angles affect meaning helps prepare young filmmakers to plan their own productions. The concepts embedded could also be used to analyze photographs and paintings.
Curated OER
Visualizing Sarah, Just Plain and Tall
Students define "visualize," practice visualizing day at beach, read poem, Crocodile Toothache, silently, listen to teacher read same poem aloud, share visualizations with classmates, read first chapter of book, Sarah, Plain and Tall,...
Curated OER
Visual Composition
Students study how elements of visual composition and group storyboards for a one-minute videotaped commercial.
Curated OER
Finding Meaning in the Badge
Children who are three to five years old study two rank badges from the Qing dynasty to develop an understanding of social rank, language skills, and symbolism. The instructional activity is discussion-based and requires learners to...
Noyce Foundation
Ducklings
The class gets their mean and median all in a row with an assessment task that uses a population of ducklings to work with data displays and measures of central tendency. Pupils create a frequency chart and calculate the mean and median....
Inside Mathematics
Suzi's Company
The mean might not always be the best representation of the average. The assessment task has individuals determine the measures of center for the salaries of a company. They determine which of the three would be the best representation...
Mathematics Vision Project
Module 8: Statistics
What does it mean to be normal in the world of statistics? Pupils first explore the meaning of a normal distribution in the eight-lesson module. They then apply the statistics related to normal distributions such as mean, standard...
Curated OER
Visual and Meaning Cues
Learn how to apply visual and meaning cues to reading unknown words. Readers will explore what to do when they come to a word they do not know as they watch the teacher model the use of these cues and then participate in guided and...
Curated OER
Words Have Meaning
Learners interpret and analyze art for meaning and a Maya Angelou poem for meaning. In this art and literature analysis instructional activity, students analyze Alison Saar's "Lost and Found" and Maya Angelou's poem "Alone." Learners...
Curated OER
Strategies for Determining the Meaning of a Word
What does that word mean? I can sound it out, but it just doesn't make sense. Teach your class a sure fire strategy to combat those pesky unknown words. You'll introduce the concept of context clues through metacognitive modeling,...
Curated OER
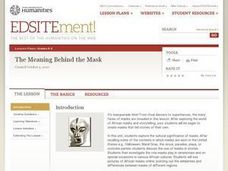
The Meaning Behind the Mask
Students explore the world of African masks and storytelling. They create masks that tell stories of their own.
Curated OER
Applying Central Tendency
Twelfth graders calculate the mean, median, and mode of various wages. They apply these skills to asking for pay raises. They discuss whether the mean, median, or mode provide the highest wage increase.
Curated OER
Special Ed. Resource
Ways to organize data is the focus of this math PowerPoint. Students view slides that define and give descriptions of a variety of graphs, and how mean, median, and mode are found. A good visual tool which should benefit almost all types...
MDE k-12
Lesson 5: The Journey Becomes Larger Than Life!
Many muralists throughout history have focused on using their art to represent aspects of their culture or community. After thoroughly researching several muralists, budding artists will create a larger than life mural that contains...
Curated OER
Lesson: Paul Chan: Alternumeric Fonts
Learning to analyze language, symbols, and codes is part of becoming a deep and critical thinker. Young analysts consider their ability to see hidden messages as they analyze the work of Paul Chan. There are two fully developed...
Curated OER
Mapping Your Identity: A Back-To-School Ice Breaker
Identify the unique personal attributes of your class members. Begin by viewing the Visual Thesaurus and discussing displayed attributes associated with famous American leaders. Using these identity maps as models, pupils generate nouns...
Curated OER
Times Tables - Multiplication
Introduce students to multiplication through this fantastic math worksheet. Provides beginners with an explanation of multiplication as repeated addition using pictures to help students visualize the meaning and process of multiplying....
Curated OER
What We Eat, Where We Sleep: Documenting Daily Life to Tell Stories
This is not just a New York Time article to read, this is a set of amazing activity ideas all related to the slide shows "Breaking Bread Everywhere" and "Where Children Sleep." Your class can view each show, read about what they mean...
Perkins School for the Blind
Conductors of Heat - Hot Spoons
Why is the end of a spoon hot when it's not all the way in the hot water? A great question deserves a great answer, and learners with visual impairments will use their auditory and tactile senses to get that answer. A talking...
Illustrative Mathematics
Offensive Linemen
Comparing college football teams, Division I is said to have heavier lineman than Division III. Your mathematicians are given data from two different divisions and will have to interpret a dotplot and calculate the difference in weight...


