Curated OER
Vernier - A Speedy Slide with EasyData™ App and CBR 2™
Mathematicians use a CBR 2™ motion detector to determine their speed or velocity going down a playground slide. They also experiment with different ways to increase their speed going down the slide. Finally, students complete the Student...
Curated OER
Vernier EasyData App
Used along with data collection devices, the EasyData Application for the TI-83 Plus/TI-84 calculator allows learners to use real data to learn math and science. Statistics, curve fits, and integrals are used to analyze the collected...
Curated OER
Graphing Your Motion with Vernier LabQuests
Seventh graders create motion graphs using a motion sensor. In this physics lesson plan, 7th graders match the graph shown by moving their body. They relate the slope to the way they moved.
Curated OER
Dependence of Light Intensity on Distance
Hopefully you have a sensor interface for your physics class to use with graphing calculators when collecting data with a light sensor. If so, read on. Use this resource for learners to predict and then test whether or not the intensity...
Curated OER
Levers and Pulleys
Seventeen pages of material leave you well-prepared to carry out this activity on levers and pulleys. Photos and diagrams make the instructions clear; resource links provide additional information. The missing aspects of this teacher's...
Curated OER
Manometer
There are several instruments that can be used to measure the pressure of a gas. Here, junior chemists venture into the workings of a manometer. Barometers the Boltzmann Distribution are also detailed. A highlight of this presentation is...
Curated OER
Activity: Slinkies and Magnetic Fields
Your advanced physics class will appreciate this lesson in which they use magnetic field sensors to determine the relationship between the number of turns per meter of a solenoid and the magnetic field produced. The materials for this...
Curated OER
Great Lakes Ecology
Students are able to use a secchi disk to measure the turbidity of water by determining the depth at which the sechi disk is no longer visible and using the data in a formula to quantify the results. They are able to use Vernier probes...
Curated OER
Land Erosion - Does Vegetation Matter?
Young learners explore erosion, deposition, weather and climate in this science instructional activity. They discuss the cause of erosion, collect data and analyze it suing the TI Explorer. They can also use the TI CBL or Vernier LabPro...
Curated OER
Name That Tune: Matching Musical Tones Through Waveform Analysis
Pupils detect the waveform of musical notes to determine the code for the "safe" in this forensics simulation instructional activity. They use a microphone and tuning forks along with Vernier EasyData on their graphing calculator to...
Texas Instruments
TI-Nspire™ CAS
When it comes to rating educational calculators, this calculator is always near the top of this list. Now it's available as an app. There is a lot of calculator power wrapped up in this app. Not only is this a fully functioning...
Texas Instruments
TI-Nspire™
We landed on the moon with less computing capabilities than you can find in this app! Here is a multiple function calculator that takes all the power you get from a handheld and adds the wonderful large screen that only a tablet can...
NOAA
Come on Down!
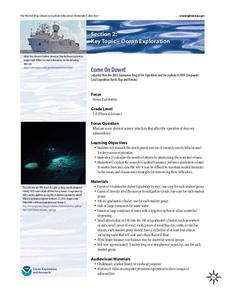
What do we do when a dive is too dangerous for humans to accomplish? Send in the robots! Middle school scientists get acquainted with several different models of submersible robots in the second lesson of six from NOAA. Lab groups then...
Curated OER
Graphing Your Motion
Seventh graders investigate velocity and speed. In this Vernier Probe lesson, 7th graders will use probes to calculate motion, speed, and velocity of an object. They will create a graph of their collected data.
Curated OER
DETERMINING THE CONCENTRATION OF A SOLUTION: BEER'S LAW
Students determine the concentration of an unknown nickel (II) sulfate solution by using the colorimeter.
Curated OER
States Of Matter
Delv into the states of Matter. Students engage in the scientific inquiry process to uncover the exciting world of Matter. They watch a series of videos, and conduct experiments in order to collect and analyze data on the various state...
University of Georgia
Energy Content of Foods
Why do athletes load up on carbohydrates the evening before a competition? The lesson plan helps answer this question as it relates the type of food to the amount of energy it contains. After a discussion, scholars perform an experiment...
Curated OER
How Dense is Salt Water?
Young schoolers explore the concept of linear regression. They determine the mass and density of salt water. Pupils add salt to water and record the density as salinity increases, and perform a linear regression on the data to model the...
Curated OER
Murder in the First Degree - The Death of Mr. Spud
Secondary learners investigate exponential functions in a real-world scenario. They collect data on the temperature of a cooling baked potato, enter the data into lists, and graph the data using a scatter plot before finding an...
University of Georgia
Endothermic and Exothermic Reactions
Equip your chemistry class with the tools to properly understand endothermic and exothermic reactions. Young chemists collect, analyze, and graph data to determine how the Law of Conservation of Matter is applied to chemical composition...
Normal Community High School
Scientific Measurement
Pupils learn everything from how to take scientific measurements, to accuracy/precision, to density and a plethora of topics from a presentation on the metric system.
Curated OER
Experimenting with Pressure and Volume
Students explore the relationship between temperature and pressure using a paper-pencil laboratory activity and software. The nature and behavior or gases with respect to temperature is the focus of this lesson.
Curated OER
Boiling and Freezing Points of Water
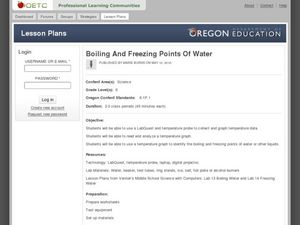
Challenge your sixth graders with this instructional activity about the freezing and boiling points of water. In these activities learners graph temperature data, read and analyze information, and identify the freezing and boiling points...
Teach Engineering
Matching the Motion
It is not always easy to walk the straight and narrow. In the sixth portion of a nine-part unit, groups actively recreate a graph depicting motion. Individuals walk toward or away from a motion detector while trying to match a given...
Other popular searches
- Vernier Calipers
- Vernier Calorimeter
- Vernier Probes
- Working of Vernier Calipers
- Vernier Ph Probes
- Vernier Colorimeter
- Vernier Scale
- Vernier Callipers
- Vernier Caliperes


