Curated OER
Olympic Bar Graphs
In this Olympic bar graph worksheet, students pick a sport from the 2004 Olympic games and find data from the Olympic web page. They graph the scores (times, distance, or speed) and the medals. They answer questions about the variables...
Curated OER
Relating to Newton's Second Law
Twelfth graders study the relationships of the 3 variables in Newton's Second Law. They design an experiment to test the relationships among the variables. Students work cooperatively with members of a team. They also analyze data to...
Curated OER
You Talkin' To Me?: Investigations in Animal Behavior
Middle schoolers investigate a variety of animal behaviors, examine various modes of animal communication, and develop a catalog analyzing, interpreting, and reporting their results.
Curated OER
Science Experiments - The Low-down
Third graders discover the process thinking about science experiments, and why they are important. They work in small groups using incline planes and a small toy car to design one scientific question that can be answered through...
Curated OER
Exploring Muscle Action in the Human Body
Students collect and graph data and use the internet to research the skeletal muscles.
US Navy
The Science of Diving
Introduce gas laws using the popular topic of SCUBA diving. This activity makes a connection between the gas laws and the effect of pressure and temperature changes during diving. Young engineers complete introductory experiments to...
Curated OER
Investigating Plant Pigments: A Guided Inquiry Laboratory Experiment
Students participate in a three-part lab in which they investigate plant pigments. Part I is designed to teach basic laboratory techniques of column chromatography, in Part II students design an experiment to separate the components of a...
Curated OER
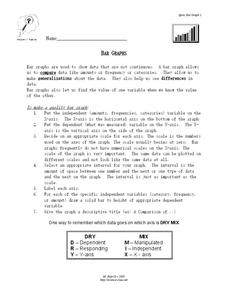
Bar Graphs
In this bar graph worksheet, students read about making quality bar graphs and they make a bar graph using given data. They answer 5 questions about their graph.
Curated OER
Microorganism Multiplication
Sixth graders conduct experiments with yeast to study characteristics of microorganisms. They, working is small groups, change the variables in the experiments and note the results which they later discuss as a class.
Virginia Department of Education
Mystery Iron Ions
Young chemists perform an experiment to determine if a compound is iron (II) chloride or iron (III) chloride. Then they determine the formula, balance the equation, and answer analysis questions.
Curated OER
Separation of Unknowns in a Liquid
Students identify chromatography as method of separating the components of a liquid. Students discover that dyes are composed of more than one component in achieving a particular color in these lessons on paper chromatography.
Curated OER
Mapping Animal Behavior
Students discuss the value of sampling in science. They, in groups, map cricket movement in response to various stimuli and graph their results.
Curated OER
I C E ( Ice Cream Experiments) Lesson
Young scholars make ice cream. They use the experimental process to improve the ice cream working with variables in the recipes.
Curated OER
Hopper Hunt: IPM Decision-making in Alfalfa
Students describe migrations and life cycle pattersn of a key alfalfa pest, the Porato Leafhopper. They define the Economic Inquiry Level and Economic Threshold. Students evaluate data in relation to profit as it applies to IPM. They...
Curated OER
Science: Draining the Land - the Mississippi River
Learners use topographic maps to identify parts of rivers. In addition, they discover gradient and predict changes in the channels caused by variations in water flow. Other activities include sketching a river model with a new channel...
Curated OER
Alcoholic Fermentation in Yeast
Biology learners investigate the effect of sucrose concentration on yeast alcoholic fermentation. During the lesson plan,they compare and contrast the processes of cellular respiration and alcoholic fermentation. They design an...
Curated OER
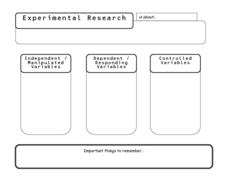
Experimental Research
In this experiment worksheet, students give examples of independent, dependent, and controlled variables. This worksheet is a graphic organizer.
Curated OER
Experimenting with Motion
Students design an experiment to change the motion of a rolling marble. In this designing an experiment lesson plan, students form a research question, they develop a hypothesis and they design an experiment using a graphic organizer to...
Curated OER
Cooking Up the Scientific Method
First graders identify the different steps of the scientific method. In this life science lesson, 1st graders apply this method when conducting a series of hands-on activities. They collect data and write observations in their journals.
Curated OER
Prediction
Students' recognize the various roles of predicting in science. Students' practice making and interpreting predictions; experimenting to test their hypotheses; and refine their predictions based on observation and experimentation....
Curated OER
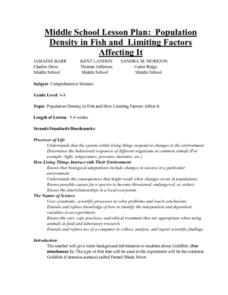
Population Density In Fish
Students investigate how a population of fish multiplies in an ecosystem and the kinds of things that must be done to maintain a healthy population balance with other organisms that live there. They conduct an experiment to test the...
Curated OER
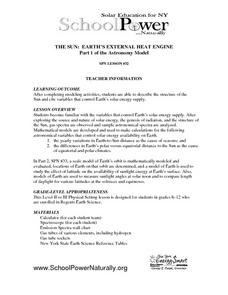
The Sun: Earth's External Heat Engine - Part 1 of the Astronomy Model
Designed by School Power...NaturallySM, this lesson familiarizes advanced earth science and physics learners about the variables that affect our supply of solar energy. They examine gas spectra and perform calculations. There is an...
Curated OER
Solar Kit Lesson #11 - Power Maximum: An Electrical Determination
Collaborative groups connect resistors and solar panels in series and measure electrical resistance, voltage, and current. The objective is to order 16 solar panels from strongest to weakest. They graph current-voltage and power curves...
Polar Trec
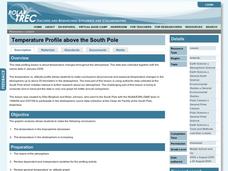
Temperature Profile above the South Pole
Collecting and understanding data is a big part of understanding the world and how it changes. To better grasp what temperatures are changing and how they affect global populations, learners create a graph based on the date provided....

