US Department of Education
National Center for Education Statistics: Create a Graph Tutorial
This tutorial walks students through how to create different types of graphs using the Create a Graph tool available on the website. Covers bar graphs, line graphs, pie charts, area graphs, scatter plots, and dependent and independent...
Lumen Learning
Lumen: Boundless Communications: Using Other Supporting Materials
This lesson focuses on other materials used to support your speech including analogies, definitions, and a variety of visual aids. SL.11-12.5 Audio Visuals
Shodor Education Foundation
Shodor Interactivate: Pie Chart
Students investigate how a pie chart can be used to display data graphically. The resource includes the activity and instructor resources.
University of Texas
Inside Mathematics: Parking Cars [Pdf]
This task challenges a student to use their understanding of scale to read and interpret data in a bar graph.
Read Works
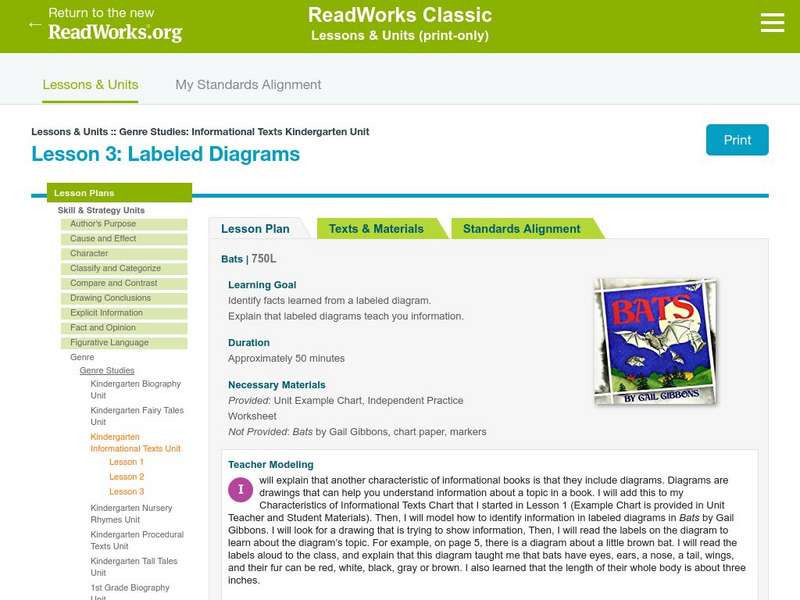
Read Works: Genre Studies: Informational Text Kindergarten Unit: Labeled Diagrams
[Free Registration/Login Required] Lesson uses Bats by Gail Gibbons to teach learners how to identify facts learned from labeled diagrams within an informational text. Ideas for direct teaching, guided practice, and independent practice...
Alabama Learning Exchange
Alex: Determining Percent of Seed Germination
In this project, students will conduct an experiment to determine the percentage of seed that will germinate in a given time frame. Students will produce charts and graphs to represent the results algebraically. Mathematics and...
CK-12 Foundation
Ck 12: Types of Data Representation: Graphic Displays of Data
[Free Registration/Login may be required to access all resource tools.] Here you will explore displays of data using bar charts, histograms, pie charts and boxplots, and learn about the differences and similarities between them and how...
Ohio State University
Ohio State University: Proteins and Nucleic Acids
This information can be used for exam review or as an introduction. It presents a good overview of the topics with charts, graphs, links, and a quiz.


![Inside Mathematics: Parking Cars [Pdf] Lesson Plan Inside Mathematics: Parking Cars [Pdf] Lesson Plan](https://d15y2dacu3jp90.cloudfront.net/images/attachment_defaults/resource/large/FPO-knovation.png)


