Curated OER
Latitude
Your young geologists generate a graph given a table of values from the context of latitude and percent of the earth's surface north of that latitude. The questions in the activity then focus the learners to a deeper understanding of the...
Curated OER
Interactivate: Introduction to Functions
This interactive website provides a variety of lesson plans according to which standards you are applying and which textbook you use. Introduce functions to your class by having them construct single operation machines and create...
Curated OER
Systems of Equations and Real Life
What a great classroom resource! The intention of this lesson is to show that real-world math can and should be applied to the community in which your students reside. The class relates properties of equations to solving for species...
Curated OER
Maryland’s Chesapeake Bay Landscape Long Ago and Today
Combine a fantastic review of primary source analysis with a study of Captain John Smith's influence on the Chesapeake Bay region in the seventeenth century. Your young historians will use images, a primary source excerpt, and maps...
Curated OER
Delivery Trucks
Written to assess learners' knowledge of interpreting expressions that represent a quantity in terms of its context, this machine-scored task also allows for a good discussion about units guiding the problem solving and solution.
West Contra Costa Unified School District
Correlation and Line of Best Fit
Computers are useful for more than just surfing the Internet. Pupils first investigate scatter plots and estimate correlation coefficients. Next, they use Microsoft Excel to create scatter plots and determine correlation...
Illustrative Mathematics
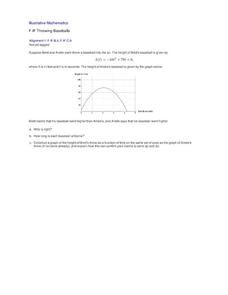
Throwing Baseballs
This is a wonderful exercise for learners to apply their critical thinking skills along with their knowledge of quadratic functions and parabolas. Young mathematicians investigate a real-world scenario about the height a baseball reaches...
Noyce Foundation
Truffles
Knowing how to scale a recipe is an important skill. Young mathematicians determine the amount of ingredients they need to make a certain number of truffles when given a recipe. They determine a relationship between ingredients given a...
Alabama Learning Exchange
Human Slope
Middle and high schoolers explore the concept of slope. In this slope lesson, learners graph lines using a life-size graph. They use chalk on a blacktop to create a coordinate plane and use each other as the tick marks on the grid....
Curated OER
Exponential Functions
Your algebra learners analyze and interpret the general form and the graph of two functions. The increase of the function due to the multiplicative factor is emphasized.
Curated OER
The Parachute
Students discuss parachutes and write a procedure to determine the effect of different size parachutes and different masses on the time it takes the masses to fall. They record all their data from their experiment then write three...
EngageNY
Comparing Quadratic, Square Root, and Cube Root Functions Represented in Different Ways
Need a real scenario to compare functions? This activity has it all! Through application, individuals model using different types of functions. They analyze each in terms of the context using the key features of the graphs.
Achieve
Dairy Barn
Agriculture is truly a math-based profession! Help the dairy farmer determine the supplies needed to complete his barn. Using given dimensions, learners build equations and use units to determine the correct amount of materials.
Curated OER
Dental Impressions
What an impressive task it is to make dental impressions! Pupils learn how dentists use proportional reasoning, unit conversions, and systems of equations to estimate the materials needed to make stone models of dental impressions....
Curated OER
Valentine Candy Count
Here is an imaginative take on a classic lesson! Young scholars discover what color Valentine Candy is found more often than any other in a standard bag of Valentine Conversation Hearts. They observe, predict, sort, and classify the data...
Curated OER
Unit II: Worksheet 1 - Velocity
Beginning physics scholars interpret two graphs depicting position versus time. For each graph, there is a series of questions to answer. The exercise is basic, but beneficial. Consider using it as an assessment of understanding after...
Curated OER
Systems of Equations: What Method Do You Prefer?
Students explore the concept of solving systems of equations. For this solving systems of equations lesson, students watch YouTube videos about how to solve systems by graphing and by elimination. Students use an interactive website to...
Mathematics Assessment Project
Representing Trigonometric Functions
Discover the classic example of periodicity: Ferris wheels. Young mathematicians learn about trigonometric functions through Ferris wheels. They match functions to their graphs and relate the functions to the context.
Curated OER
Solving Linear Inequalities
Walk the class through the steps of how to evaluate linear inequalities in one variable and graph the solution set. Define and discuss key vocabulary terms, then have individuals work problems of varying difficulty. Included are word...
Curated OER
Buying Cars/Financing Cars Compound Interest
Provide a real world context in which exponential functions are used to determine a eal world phenomena such as compound interest and exponential growth. This instructional activity should be taught after students have mastered the laws...
Curated OER
A Closer look at Oil and Energy Consumption
Upper graders analyze basic concepts about the consumption, importation and exportation of the worlds oil production. They create several graphs to organize the data and draw conclusions about the overall use of oil in the world.
EngageNY
Modeling with Polynomials—An Introduction (part 2)
Linear, quadratic, and now cubic functions can model real-life patterns. High schoolers create cubic regression equations to model different scenarios. They then use the regression equations to make predictions.
Cornell University
Math Is Malleable?
Learn about polymers while playing with shrinky dinks. Young scholars create a shrinky dink design, bake it, and then record the area, volume, and thickness over time. They model the data using a graph and highlight the key features of...
Curated OER
A Contouring We Go
Students examine the built environment and infrastructures of their community by constructing contour equipment, using the equipment, and comparing their results to current topographical maps of the same area


