US Department of Commerce
My Dream Home
Dream big or go home. After analyzing a bar graph on the number of bedrooms in US homes derived from census data, scholars design their own dream homes. They cut out two-dimensional shapes from construction paper to create models of...
DocsTeach
Exploring America's Diversity: Gertrud Danneberg (Beginner)
Everyone is an immigrant in their own way. Young scholars read historic documents to understand one woman's journey from Germany to the United States. The activity uses a mixture of text, discussion, and written prompts to help...
US Department of Commerce
Exploring Sampling Variability - Higher Education Attainment Across The United States
More education in statistics is always beneficial. Given cards that provide the proportion of adults with bachelor's degrees in 10 random US states, scholars individually determine the sample percentage of states in which more than 30...
DocsTeach
Exploring America's Diversity: Luther Powell (Beginner)
Luther Powell immigrated to the United States to live the American dream—and create a better life for his son, four-star general Colin Powell. Elementary academics look at documents, such as, ship records to understand the immigration...
Curated OER
Censusmania
Learners understand how the census can reveal information about people and history. They create their own census.
Curated OER
Exploring Racial and Ethnic Diversity
Pupils explore and examine racial and ethinic diversity in the metropolitan areas of the United States. They examine data from the US Census Description of Race and Ethnic Categories. Students explore the population by race and ethnicity...
Curated OER
Size It Up: Map Skills
Compare information from a US population cartogram and a standard US map. Learners draw conclusions about population density by analyzing census data a population distribution. They discover that census data is used to apportion seats in...
Curated OER
Teenage pregnancy trends in Canada
Students analyze demographic data relating to teen pregnancy trends. They develop skills to locate and interpret data. They discuss the factors that influence teenage pregancy such as social, economic, and educational issues.
Curated OER
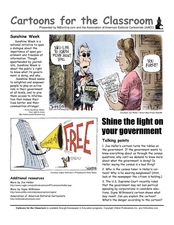
Cartoons for the Classroom: Shine the Light on Your Government
What don't we know about our government? Explore the concept of transparency and freedom of information throught this analysis handout, in which scholars examine 2 political cartoons. Background information provides context, explaining...
Curated OER
Statistics Canada
Students practice using graphing tools to make tables, bar charts, scatter graphs, and histograms, using census data. They apply the concept of measures of central tendency, examine the effects of outliers. They also write inferences and...
Curated OER
Reading Primary Source Documents: Historical Content
Why do we read primary source documents? What can they give us that other writings cannot? Provide your learners with any of the primary sources attached here (there are seven), and have them complete the graphic organizer (which opens...
Curated OER
Committing to Respect: Lessons for Students to Address Bias
Here's a guide designed to build safe, respectful learning environments, and to build understanding of the value of diversity through lessons packed with activities for specific grade levels.
CK-12 Foundation
Interpretation of Circle Graphs: Northwest Region Population Pie
Given populations of the five Northwestern states, learners create a circle graph. Using the data and the pie chart, they make comparisons between the populations of the states. Finally, the pupils determine how the chart will change...
Curated OER
Mapping the changes in Canada's population
Learners find and analyze data found in the census. They compare the population from 1996 to 2001. They explore the type of data they can find in the Census of Population.
Curated OER
Distribution of children living at home
Students examine census data to evaluate the number of students of certain ages living at home. This data is then used to determine the need for day care, or other social programs. They use this information to explore social policies.
Curated OER
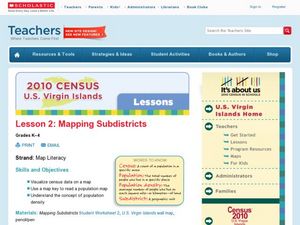
Lesson 2: Mapping Sub-districts
Students learn more about the census. In this mapping sub-districts lesson plan, students visualize census data on a map, use a map key to read a population map, and better understand the concept of population density.
Curated OER
The First Nations, Métis, and Inuit Peoples of Canada
Students explore demographic shifts. In this Canadian Census lesson, students interpret data from the 2006 Census to determine the needs of the Aboriginal population in the country.
Curated OER
Government and Politics
Challenge your students' knowledge of the American government with this activity, which prompts them to fill in missing key terms (no word bank is provided, allowing students to come up with answers on their own) and complete short...
Curated OER
Race and Ethnicity in the United States
Students explore race and ethnicity as it is defined by the U. S. Census Bureau. They compare data from 1900, 1950, and 2000 and identify settlement patterns and changes in population. In groups, they map these changes and discuss...
Curated OER
Census Data and New Hampshire History
Students graph the population growth of New Hampshire using historical census data.
Curated OER
Count On Us: Concepts and Applications of Demography
Eighth graders use the Internet to research demographics of certain areas. They use the U.S. Census Bureau's website to help them gather information. They use their data to find a solution to a hypothetical problem.
Curated OER
Biggest US City by Letter Quiz
In this online interactive geography quiz activity, students respond to 26 identification questions about U.S. cities. Students have 5 minutes to complete the quiz.
Curated OER
The Changing Nature of Work, Employment, and Education in Canada.
Students identify the effect caused by change of employment and education. In this statistics lesson plan, students analyze data and draw conclusions. This assignment tests students' ability to use data correctly.
Curated OER
The Immigrant Experience
Students utilize oral histories to discover, analyze, and interpret immigration and migration in the history of the United States. A goal of the unit is fostering a discussion and encouraging students to make meaning of the bigger...
Other popular searches
- Us Census Bureau
- Us Census Activity
- 2010 Us Census
- Us Census Graphing
- Us Census Native American
- Government Us Census
- Linear Regression Us Census
- Analyzing Us Census Data
- Us Census African Americans
- Us Census Worksheets
- Us Census Lesson Plans
- History of the Us Census


