Curated OER
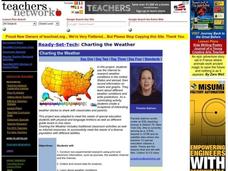
Charting the Weather
Students research and conduct non-experimental research, such as journals, the weather channel and the internet, to collect and record data for analysis on weather conditions in the United States and abroad. They identify, pronounce and...
University of Wisconsin
Why Did the Triangle Fire Occur?
An investigation of the 1911 New York City Triangle Shirtwaist Factory fire leads class members to examine primary and secondary source materials related to the event and apply what they learn about the working conditions at the time to...
Teaching Tolerance
Changing Demographics: What Can We Do to Promote Respect?
America has always been seen as a melting pot to the world. Scholars research the concept of blending cultures in the United States and how it is changing over time. The final lesson plan of a four-part series analyzes the changing...
Curated OER
Where Do People Move To Or From?
Students identify countries of origin of their ancestors, graph patterns of migration to the U.S. and Hawaii, then utilize oral history as a primary document by interviewing their ancestors or parents to explain why they moved to their...
Curated OER
Fill in Your Future
Students discuss the Census 2000 slogan, "This is Your Future. Don't Leave It Blank." They design billboards for the slogan. They discover the role of the census in community planning and congressional representation.
Curated OER
Educating European Immigrant Children Before World War I
Discover the challenges in educating immigrant children at the turn of the 20th century. Reforms that New York City schools used are described here and data is included for your class to analyze, in its evaluation of the effectiveness of...
Curated OER
Estimating Deer Population
Students calculate the deer population using proportion. For this algebra lesson, students apply the concept of ratio and proportion to real life scenario.
Curated OER
Lesson 3: Understanding Population Growth
Students explain population growth in Maryland and its relationship with age structure, household growth and consumption of land.
Curated OER
People and Parks in the U.S.A.
Fifth graders explore the National Parks in the United States. After locating specified states, 5th graders predict which states have the most National Parks. Given the population of each state, students determine the average acre per...
Global Oneness Project
Citizen Photojournalism
Matt Black's photo essay, "The Geography of Poverty" provides a shocking reminder of the poverty that exists in the United States. The resource not only focuses attention on poverty but also conditions that have given rise to situation...
Curated OER
About the U.S.A.
Students research the United States and discover its different climate zones, geographical features, animal life, and various cultures. Students complete a research chart using books, encyclopedias and the internet and present their...
Curated OER
Reshaping the Nation
Students learn why the census makes a difference. In this U.S. Census lesson plan, students learn how to read and use a cartogram while they explore new ways to represent data.
Curated OER
Then and Now
Students conduct research and use census data to compare different times and places. In this census lesson, students interpret data from charts and graphs, comparing census information from two time periods as well as from two different...
Curated OER
Race, Education, and Income: Comparing Carter & Reagan
High school learners compare economic outcomes for 3 racial groups under the presidencies of Jimmy Carter and Ronald Reagan by analyzing a series of graphs, answering questions from a worksheet, and participating in a discussion.
Curated OER
Map Literacy
Students locate their home state on a map. They differentiate between physical and population sizes of states. In two groups, students "become" states with string for boundaries. They ascertain that area does not always equal large...
Curated OER
From Sea to Shining Sea
Students study the geography of the United States of America. Students write letters, create travel brochures, make maps, graph population numbers, read fiction and nonfiction selections, complete KWL charts, and watch films.
Curated OER
Count On Us: Concepts and Applications of Demography
Eighth graders use the Internet to research demographics of certain areas. They use the U.S. Census Bureau's website to help them gather information. They use their data to find a solution to a hypothetical problem.
Curated OER
Census Report
Students write and or present a report contrasting geographic and demographic features (e.g., average annual income, population density, mortality rate, literacy rate) of countries where the target languages is spoken to the U.S. They...
Curated OER
Border Math
Students examine and interpret data relating to U.S.-Mexico borderland realities, and consider such aspects of social science as the study of population, crime, government spending, pollution, health, and economics.
Curated OER
Where We Live
Learners forecast future population growth of the U.S. Virgin Islands. In this U.S. Census lesson plan, students explain the factors that influence population density on the U.S. Virgin Islands, including geography and economic activity.
Curated OER
Paying for Crime
Learners participate in activties examining ratios and proportions. They use graphs to interpret data showing the government's budget for prisons. They present what they have learned to the class.
Curated OER
Air Pollution: What's the Solution?
In this air pollution worksheet, students watch a video about asthma and indicate the triggers of asthma. They also use a web site to get real time data about the ozone, particle pollution and air quality to answer four questions....
Curated OER
Time Changes Everything
Students analyze census data from 1915, 1967 and 2006. They read an article about how the world's population is growing at an alarming rate. They use primary source documents to create a timeline on the information they gathered. They...
Curated OER
Black Kentuckians and the Civil War
Students demonstrate how the American Civil War affected black Kentuckians socially and politically. They identify and discuss the 13th Amendment to the U.S. Constitution, which forced the end of slavery in Kentucky months after the...


